Abstract
In this issue of the Digital investor, we investigate the fundamental price determinants for Bitcoin and Litecoin. A close look at some fundamental network variables such as active addresses, transaction counts, difficulty and crypto-currency prices shows that there are at least two types of investors in this market. As they behave differently, this knowledge helps us to understand the price cycle from the psychology of the investors.
Based on historical evidence of both the Bitcoin and the Litecoin ecosystems, we propose a method to help determine price-bottom formation.
Introduction
Understanding the price determinants of assets is the basis for all investment analysis. There are three categories of variables that may explain price movements: macroeconomic, fundamental and technical.
Macroeconomic variables do not play a role in the cryptoverse, as it is called. This conclusion is widely accepted and supported by academic research. In a paper published last year, Liu and Tsyvinski showed that Bitcoin, Ethereum and Ripple prices are not correlated with currencies, stocks, commodities or macroeconomic factors. While this conclusion may sound disappointing at first sight when attempting to explain price movements, it is a promising finding with regard to portfolio diversification. In our October edition of the Digital Investor, we showed that adding Bitcoin to a portfolio improves the risk-return profile of the investment strategy. A 2018 report published by Kajtazi and Moro also contained similar conclusions.
Technical analysis is by far the most widely used trading technique and, according to anecdotal evidence, crypto traders use a larger arsenal of indicators and rules intended to predict price movement. However, given the vastness of the technical analysis available, we will cover these in future publications.
Consequently, fundamental analysis is the final category to explore, and this is what we will analyse in the following sections. Before continuing with the analysis, we first need to define the different types of stakeholders in the Bitcoin network. Here we broadly distinguish between traders and value investors. Traders consist of individuals and institutions who own Bitcoin or Litecoin as a financial investment, whereas value investors mainly consist of miners in the network. This is because miners are long-term believers in the network who have invested with a long-term objective in mind and have to bear the associated operational costs of mining.
Fundamental factors
When analysing the fundamentals, we look at the factors that describe the ecosystem and the state of the network. Examples of fundamental variables are active addresses, circulating supply, network difficulty and transactions, to name but a few. These are part of the vocabulary needed to understand the functioning of tokens, in the same way as EBITDA, free cash flows, discount rates and betas are part of the apparatus of the equity analyst.
Our analysis shows that three factors, i.e. active addresses, difficulty and transaction counts, play a central role in crypto-currency price formation. These three factors put together provide us with information about the psychology of the main actors in the crypto market and enable us to construct trading signals.
Network difficulty
For crypto-currencies built on a proof-of-work1 (PoW) consensus mechanism, difficulty2 is the variable that determines the approximate time taken to add a new block to the blockchain. In the case of Bitcoin for instance, a block is due to be added approximately every ten minutes. As the computers used to mine Bitcoin become more powerful and as the number of mining machines increases, the time spent mining a new Bitcoin would decline if difficulty did not increase accordingly.
As a result, difficulty gives us information about the behaviour of miners. There are two reasons why difficulty could increase. First, when Bitcoin prices increase, more miners jump into the network as the value of the block reward in dollars rises. As a result, hashrate, a measure of mining computational power, increases. Secondly, when hardware efficiency improves, even if there are no new miners, the network hashrate increases as well. Therefore, to keep the block time constant (i.e. 10 minutes) the difficulty increases accordingly.
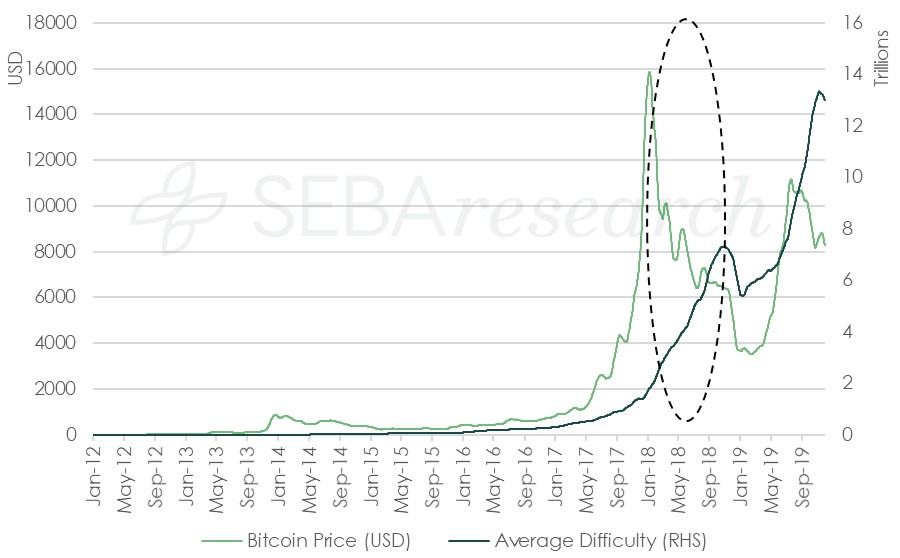
A decline in difficulty, as observed in 2018 (Exhibit 1), signals that some miners have stopped their mining activities as they have become unprofitable, given the drop in the Bitcoin price. A literal reading of Exhibit 1 indicates that when the price of Bitcoin dropped below USD 6,000, the least efficient miners abandoned their operations in order to limit their costs. It is worth noting that the price stopped falling when the difficulty bottomed out. We can think of this as the last leg in the bear market.
Exhibit 1: 30-day moving average of the Bitcoin price and average network difficulty
Transaction count and active addresses
Active addresses refer to the number of Bitcoin wallet addresses that have conducted transactions in a day, while transaction count refers to the number of transactions on a given day. As shown below (Exhibits 2 and 3), active addresses and transaction count show a close resemblance to Bitcoin price movement: as the price rises, more people tend to carry out transactions using Bitcoin.
Exhibit 2: 30-day moving average of the Bitcoin price and active addresses

Exhibit 3: 30-day moving average of the Bitcoin price and transaction count
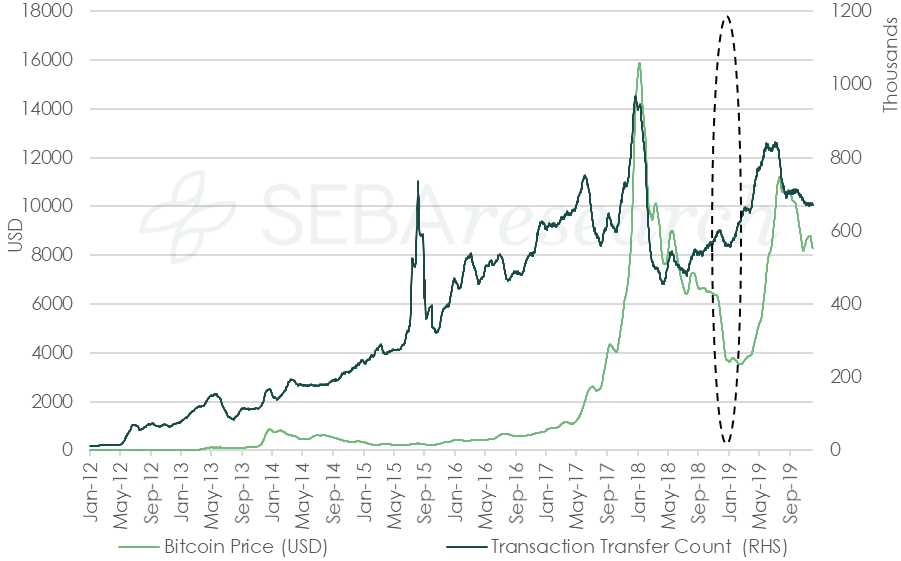
However, during November 2018, as BTCUSD fell below 6,000, transaction counts kept on growing while active addresses declined, leading to an increase in the Bitcoin value per transaction. Exhibit 4 shows that the number of Bitcoins being transferred per day increased during this episode.
Exhibit 4: 30-day moving average of the Bitcoin price and average transaction value in Bitcoins
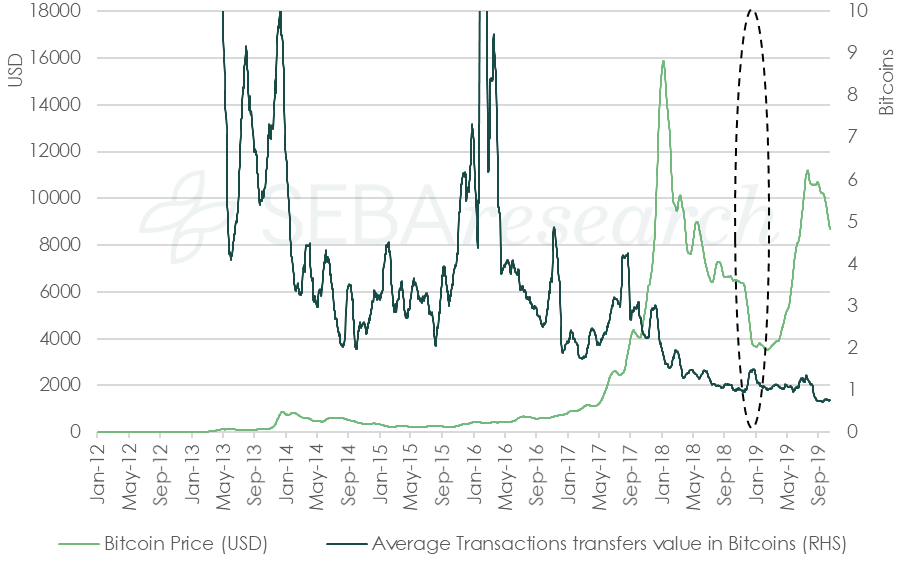
A likely explanation is that long-term investors, miners, sold off their Bitcoins to cover their operational costs, resulting in an increased transaction count, even with falling active addresses. We should keep in mind that in Exhibit 1, we showed that difficulty declined over this period. This signals a change in the psychology of long-term investors. This can be seen as an indication that all the weak hands in the market have folded their cards, and the price might find its new bottom, hence a buying opportunity.
Fundamental indicators for price bottoms
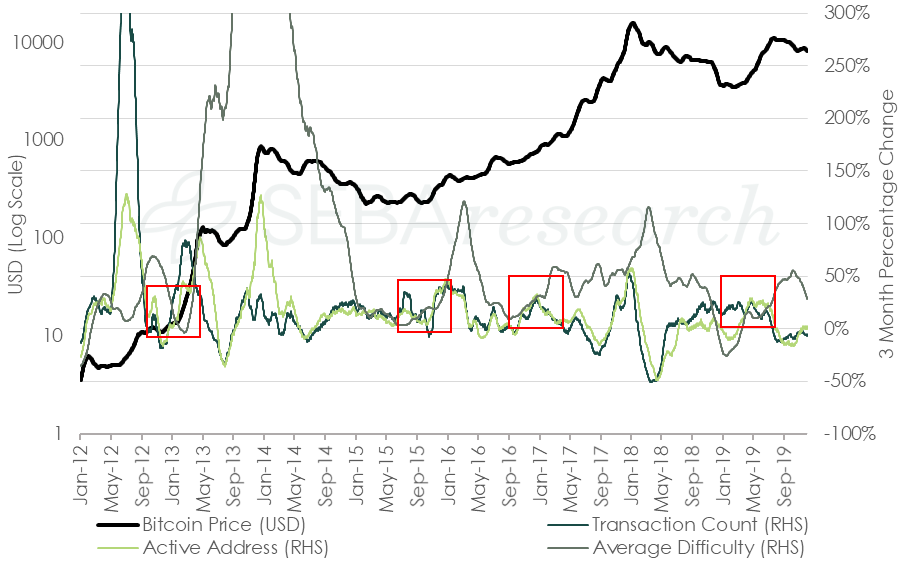
Using the fundamental factors described above, we can now build indicators to help us identify market entry opportunities. In Exhibit 5, we compare three-month percentage changes in all three factors with the Bitcoin price. We observe that when active addresses converge from below the zero percent rate of change with a hashrate near the zero percent rate of change, the Bitcoin price tends to find its bottom. A possible explanation for this behaviour is that when speculators and traders move out of the market as the price falls, we observe a decrease in the rate of change in active addresses and transaction count. Furthermore, as the price continue to fall, we see that long-term investors (especially miners with high operational costs) turn bearish, and the level of difficulty starts conversing towards active addresses and transaction counts. This is when we can say that the bear cycle is at its last stage as all investors (traders and miners, short-term and long-term investors) have capitulated. This creates a good market entry opportunity.
Exhibit 5: 30-day moving average of the Bitcoin price vs. 3-month percentage change in the 30-day moving average of network difficulty, active addresses and transaction counts
To further validate our observation, we recreated this analysis using Litecoin network data. We selected Litecoin as it is a fork of Bitcoin with a long history and closely resembles the Bitcoin network. Similar patterns can be observed on the Litecoin chart. As active addresses converge from below the zero percent rate of change with a hashrate near the zero percent rate of change, the Litecoin price tends to find its bottom (Exhibit 6).
Exhibit 6: 30-day moving average of the Litecoin price vs. 3-month percentage change in 30-day moving average of network difficulty, active addresses and transaction count

We can see that the rate of change in active addresses and hashrate in both Bitcoin and Litecoin have dropped below the zero percent line. Rate of change in network difficulty, for both the coins, also saw a decrease, and Litecoin network difficulty is currently below the zero percent line. According to our observations, neither Bitcoin nor Litecoin have bottomed out, but it should be simply a matter of time. Readers should be cautious that while history may rhyme, it never repeats itself exactly and other factors may influence future price action.
Conclusion
In this edition of the Digital Investor, we have looked at the fundamental price determinants of Bitcoin and Litecoin. By analysing price movements in relation to active addresses, transaction counts and difficulty, we have shown that there are at least two types of investors who behave differently. Based on their respective behaviour, we have provided a way to estimate the market entry point.
1For a primer on the consensus mechanism, we invite interested readers to have a look at our publication The Bridge – Consensus: the truth seeker. ↵
2Difficulty is measured in numbers. A difficulty of 1 is around 7 mega hashes per second. This means that if the difficulty is 7, the network will require at least 70 mega hashes per second to mine a new block in 10 minutes. ↵