Executive Summary
- Ups and downs punctuated the crypto market in 2021. But if there is only one direction to remember, it is up!
- Bitcoin adoption is strong as institutional investors progressively enter the market. We expect this trend to continue this year. Macro and political events will provide volatility to its price, as was the case last year.
- A massive sector rotation characterised by the decline in payment and the rise of platform chains is occurring.
- Ethereum is expected to finish its transition to ETH 2.0 this year. This will be a significant change with profound implications for its ecosystem and tokenomics.
- Alternative platforms such as Polkadot and Cardano need to deliver on their promises. Applications and user growth will be determinants.
- Decentralised finance (DeFi) applications trade at cheap valuations after a mixed performance last year. Developments in this sector may bring them back to light in 2022.
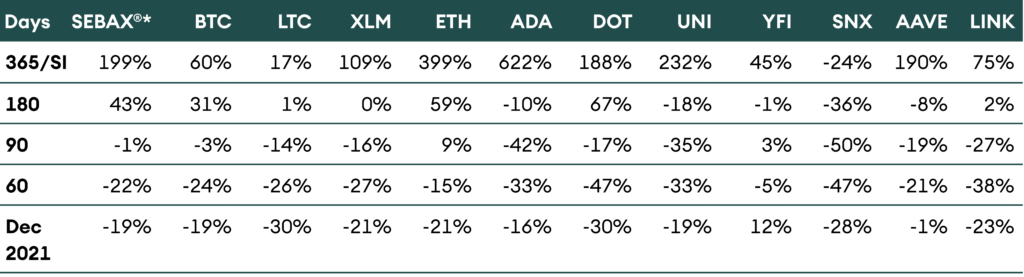
Table 1: Price performance in USD of the assets in coverage universe as of 31-Dec-2021

Introduction
Ups and downs punctuated the crypto market in 2021. But if there is only one direction to remember, it is up! According to the AMINAX index, an index representing more than 80% of the total market capitalisation, cryptocurrency prices tripled last year. The crypto market made fresh all-time highs as awareness, adoption, and use cases grew manifold.
The tripling of the market occurred despite a broad correction in the market in December. Major currencies dropped by about 20% last month. Typically, volatility is elevated at the end of the year as options contracts expire and traders book losses for tax purposes. Additionally, there was added selling pressure as large exchanges, Huobi and OKEx, had to wind down their operations in China.
Our first report of 2022 is an excellent time to reflect on what happened last year and share our thoughts for 2022. But now, at the beginning of the year, crypto stands at a crucial juncture where it must deliver on its high expectations even as macro uncertainty looms.
Bitcoin
Bitcoin experienced a tremendous year in many respects. It became a legitimate investable asset for large financial institutions and fund managers. It also marked history when El Salvador adopted it as a legal tender.
Data supports bitcoin’s rising adoption. Bitcoin transaction value increased by a staggering 367% year on year to USD 4.7 trillion. The number of active addresses, a proxy for the number of direct users, was just short of 1 million growing by 10% compared to 2020.
Figure 1: Value settled and average active addresses grew in 2021
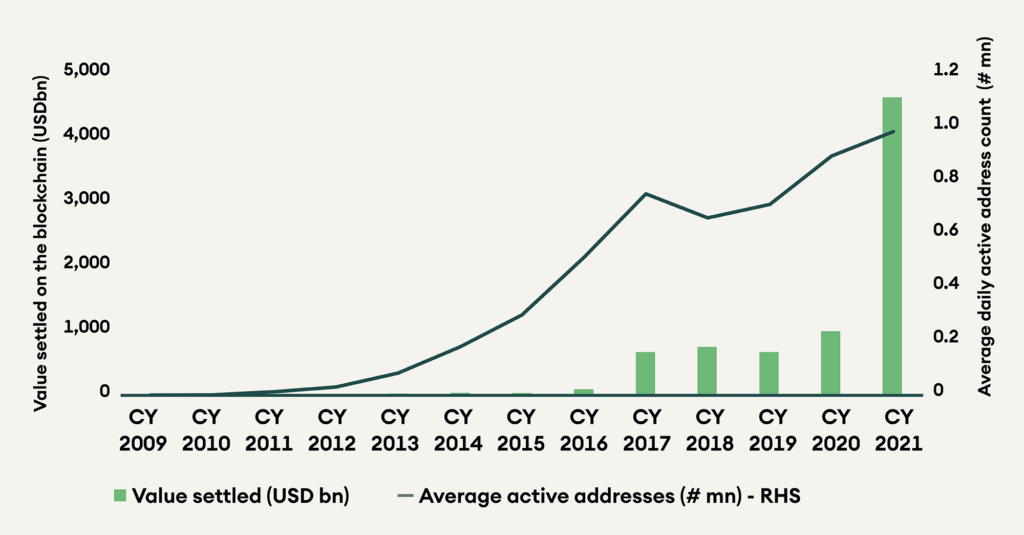
The Lightning Network (LN) – a scalable solution for bitcoin payment – that came to light after El Salvador adoption of bitcoin as a legal tender also shows a substantial increase in utilisation. The capacity of LN increased from about 1,000 bitcoins a year ago to 3,300 at the time of writing.
In line with the adoption trend described above, the price of bitcoin increased from USD 29,023 on 1 January 2021 to USD 46,355 on 31 December, a performance of 60%. During the year, bitcoin price looked like a roller-coaster, reaching a first all-time high at USD 64,000 in April, dropping to below USD 30,000 in July, recovering quickly to a second all-time high of USD 68,000 in November and declining to USD 46,355 on new year’s eve. Both tops coincided with important announcements. The first one was the public listing of Coinbase, and the second was the US inflation data printing above 6% for the first time since the early 1980s.
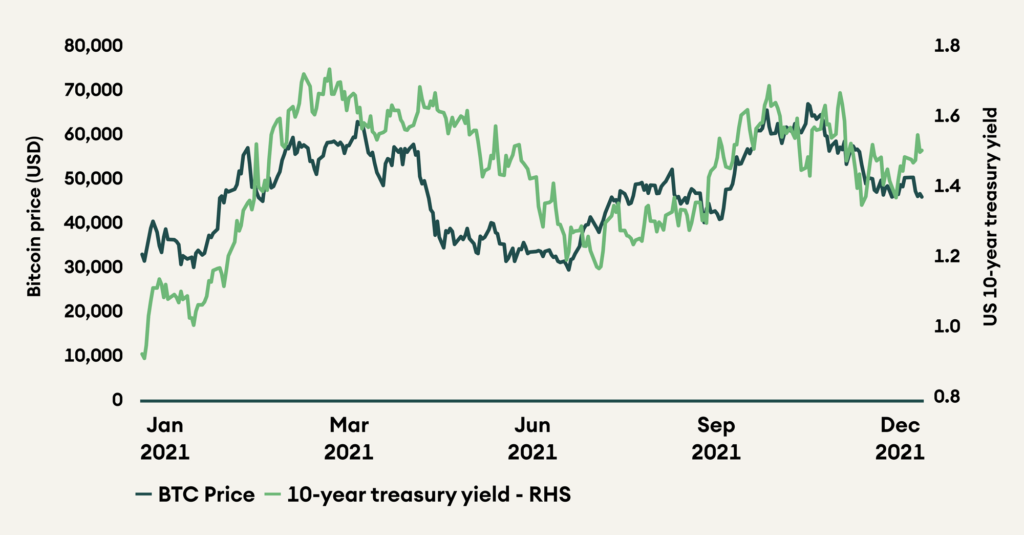
On a different topic, an interesting relationship emerged last year between the price of bitcoin and the US 10-year treasury yields. There is a positive relationship between them, meaning that when yields increase, government bond prices decline, bitcoin price increases. There are two ways to figure out the mechanism at work behind this relation. Either bitcoin acts as an additional risk-on asset, or it is a hedge against inflation. This parallel development, whether it holds further in 2022, will be worth looking at carefully as the Fed promised to raise rates this year to contain inflation.
Figure 2: Bitcoin and US-treasury yields have shown a positive relationship in 2021
While macro and political factors will impact bitcoin this year, their impact should be short-lived. Structurally, the growing adoption trend is robust and likely to strengthen further in 2022. The rising number of financial institutions ready to offer financial products on bitcoin, and more generally cryptocurrencies, to retail and institutional investors, will boost demand.
Finally, regulatory frameworks are developing. Besides Switzerland that introduced a DLT law in February last year, the European Union is preparing a Market in Crypto-Assets (MiCA) regulation for 2022 or 2023. In the United States, there is not much visibility on the development of a framework, but there is no doubt it will build one. Besides these frameworks, the interest of central banks in developing Central Bank Digital Currencies (CBDC) and of the Bank of International Settlement (BIS) and its innovation hub, the G20 and the Financial Action Task Force (FATF) to provide a comprehensive set of rules for stablecoins, the gateway to cryptocurrencies, is paving the way to the integration of traditional and decentralised finance.
Alternative Payment Chains
Payment chains, in general, are losing steam. While bitcoin (BTC) remains the largest cryptocurrency measured by its market capitalisation, its share has eroded massively, from 68% a year ago to a mere 40% today!
This movement is general as alternative payment chains have fallen in the ranking. Litecoin (LTC) dropped from the 4th to the 21st position, Ripple (XRP) from the 5th to the 8th, Bitcoin Cash (BCH) from the 7th to the 26th, Bitcoin SV (BSV) from the 13th to the 63rd and Lumen (XLM) from the 14th to the 29th. The only exception is DOGE, which moved from the 26th to the 12th position.
This relative decline is the conjunction of two factors, the rise of platforms and of stablecoins. Some platforms have become so popular – Ethereum, for instance – that their cryptocurrencies have become a payment token in addition to being utility tokens.
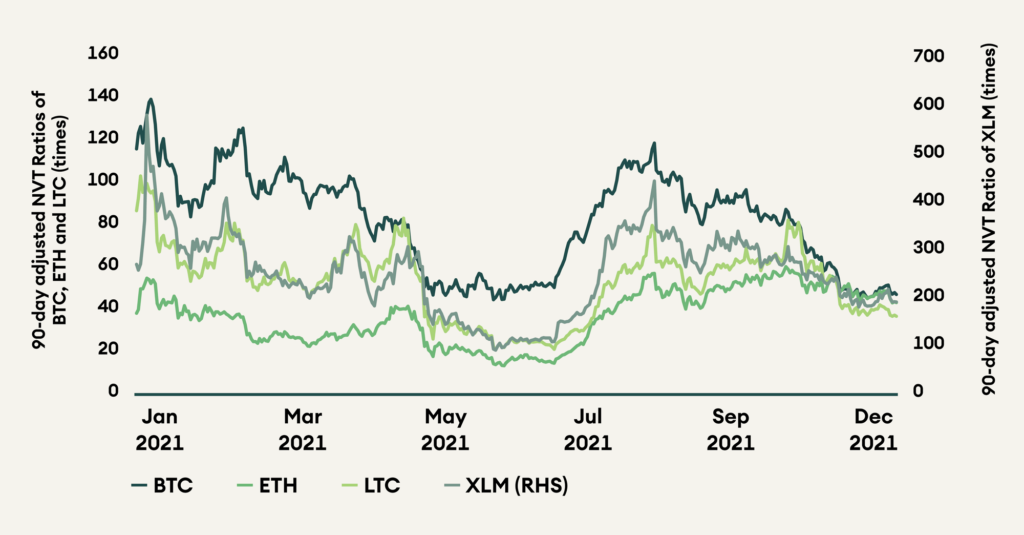
The network value to transaction value (NVT) ratio is a fundamental valuation tool to compare payment chains. It compares the market capitalisation to the amount of value settled on-chain. A low value signifies a cheap valuation. The NVT ratios for BTC, ETH, and LTC have converged to a much smaller range over the year. The NVT ratio for LTC is the lowest at 38, followed by ETH and BTC at 44 and 49, respectively. According to this metric, they all look attractive and priced similarly. The NVT ratio for XLM stays significantly higher at 197.
Figure 3: NVT ratios of BTC, ETH, and LTC have converged over the year
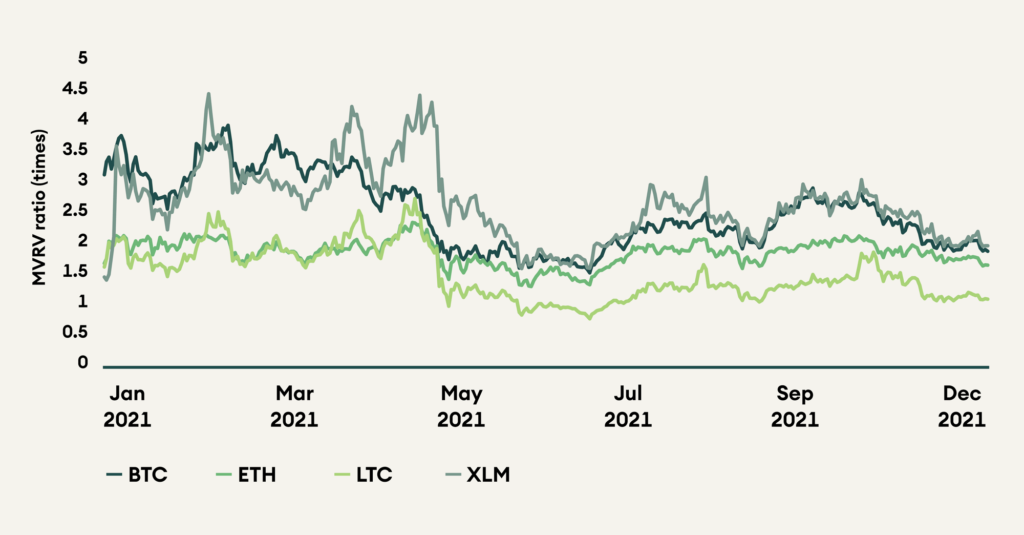
Another insightful metric to compare payment chains is the market value to realised value (MVRV) ratio. The MVRV ratio indicates the degree of profitability of holders by comparing the current market capitalisation to the sum of the value of all native coins when they were last moved on-chain. A higher MVRV ratio means that holders enjoy a higher degree of profit and are likelier to sell. Similar to the NVT ratio, the MVRV ratios of all coins have converged to a tighter range. They trade well below their yearly averages, with LTC being the cheapest at 1.1, followed by ETH at 1.7. BTC and XLM trade at MVRV ratios of 1.9 and 2.0, below their yearly average of 2.5 and 2.7, respectively. According to this metric, payment tokens look attractive.
Figure 4: MVRV ratios of all chains trade below their yearly averages
Ethereum
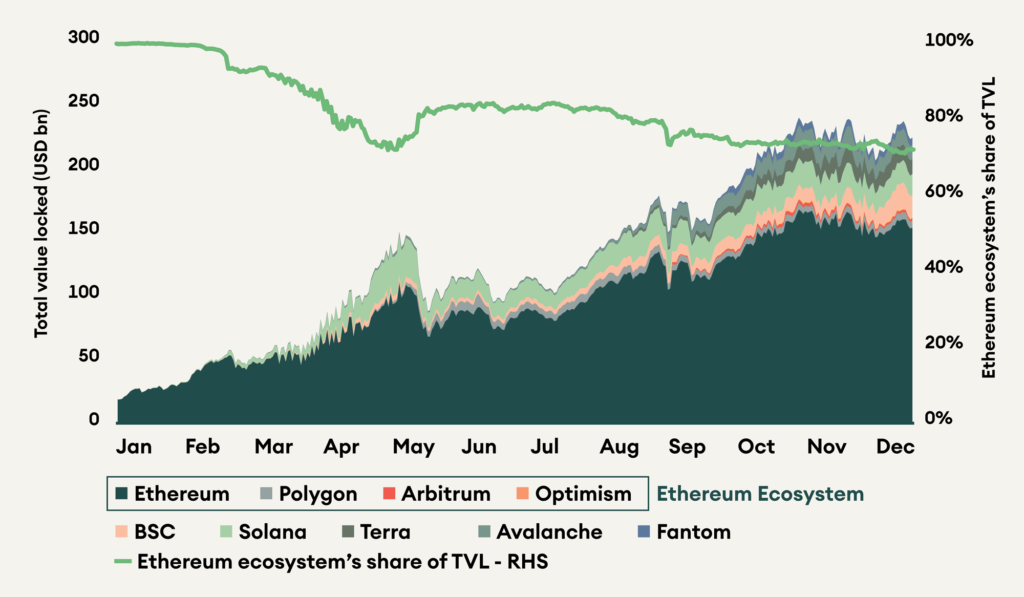
Ethereum performed well last year as it benefited from the innovation in smart contract use-cases. DeFi, NFTs, stablecoins, and metaverse all originated from Ethereum-based dapps. As a result, ETH prices increase by almost 400%. However, it has suffered from its success. Through most of the year, transaction costs on Ethereum have remained high as demand for block space has outpaced the supply. As a result, Ethereum has gradually lost market share to competing smart contract platforms like Terra and Binance Smart Chain (BSC). For Ethereum to succeed in 2022 and stop losing market share, it must complete the merge to Ethereum 2.0. The merge will transition Ethereum from proof-of-work to proof-of-stake, improve throughput, and reduce gross inflation by 90% by removing miner rewards. It will be a significant upgrade to both technology and tokenomics. The first testnet for the merge, Kintsugi, went live in December, and the mainnet upgrade is expected in Q1/Q2 2022.
Figure 5: Ethereum lost ~30% TVL market share to competing platform chains
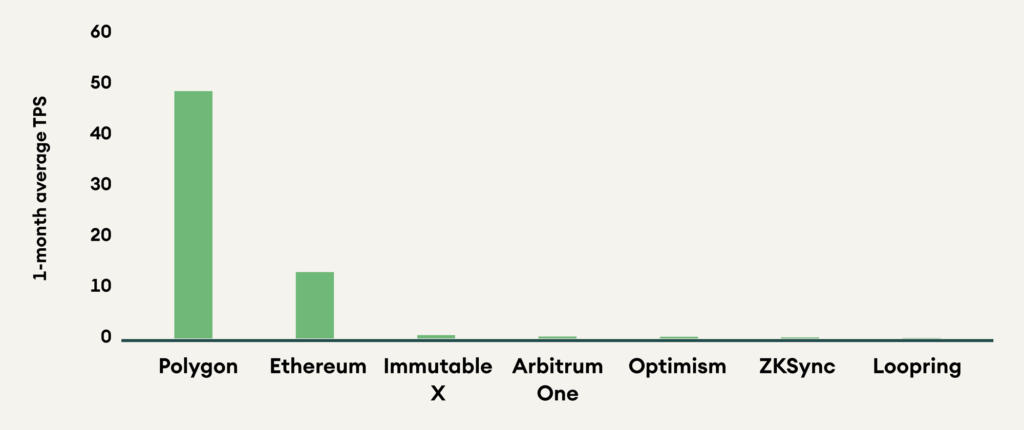
Ethereum is also pursuing a rollup centric strategy to meet the demand for block space. We covered the different scaling solutions for Ethereum in our investor education publication, The Bridge. However, other than Polygon’s sidechain, the other scaling solutions still only do a fraction of the transactions of the mainnet. Low awareness, poor user experience, high cost of bridging, and throttled throughput impede their growth. Along with Ethereum 2.0, these rollups must mature in 2022 for Ethereum to compete against high throughput chains like Solana and Avalanche.
Figure 6: Scaling solutions for Ethereum are still in their infancy
Alternative Platform Chains
Polkadot and Cardano have, perhaps, the most to prove in 2022. By the end of 2021, they have finally become technologically ready to support parachains and smart contracts, respectively. From here, developer adoption and user growth will determine their success.
For Polkadot, the first round of parachain auctions has concluded, connecting five layer-1 smart contract platforms to its interoperable layer-0 relay chain. The success of Polkadot will depend on the growth and adoption of these parachains in 2022.
Table 2: Winners of the first round of parachain auctions on Polkadot
Polkadot’s parachain auction system has a good tokenomic design that effectively reduces the amount of DOT in circulation. The first round of auctions has already bonded 99.2 million DOT, locking 10% of the circulating supply for 96 weeks. There are expected to be a total of 100 parachains, and as these auctions continue, more DOT will be locked away. With a 50% staking ratio target, and a significant amount locked in parachains, the free DOT supply is likely to be in the low double digits after the auctions conclude.
Cardano made important technological progress in 2021, finally enabling smart contracts. However, even though smart contracts are now technically possible on Cardano, essential developer tooling required to work with its unique architecture is still under development. In addition, its unique e-UTXO accounting model and choice of programming language, Haskell, have been a hurdle for smart contract development. Even after four months of smart contract launch, it still awaits the launch of its first dapp on the mainnet.
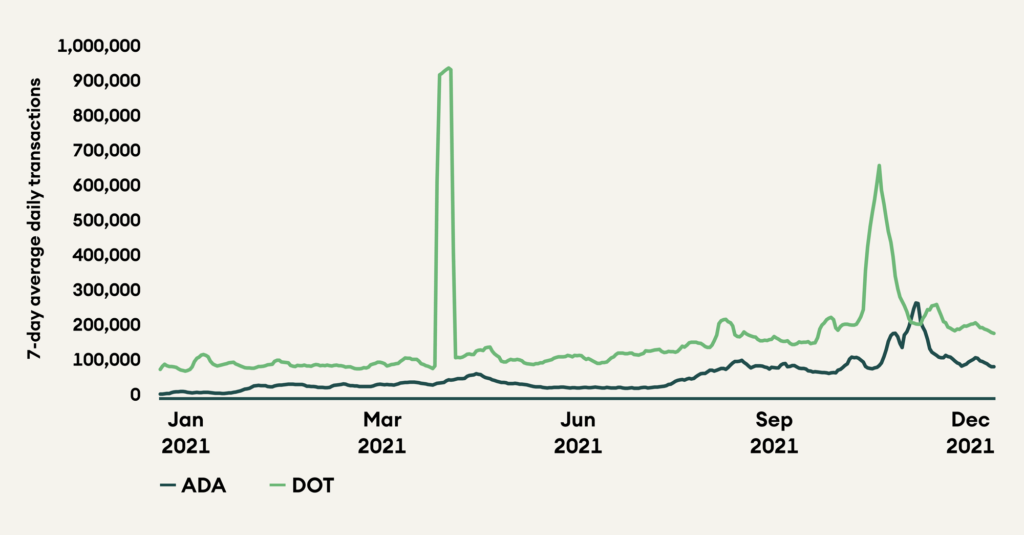
To compare the adoption of the two platforms, the number of transactions is a good indicator. The number of transactions for both chains should grow significantly as new dapps launch and new users join. There were on average 215,000 transactions on Polkadot in December, almost twice as much as on Cardano.
Figure 7: Transaction count on Polkadot is almost two times that on Cardano
Decentralised Finance (DeFi)
Decentralised finance recorded mixed performance in 2021. Earlier in the year, there was euphoria regarding the possibilities on DeFi, but it did not meet those expectations in delivery. User growth has been stagnant, with changing narratives and high transaction costs being the primary roadblock. However, Q4 did see a mild recovery in user growth, adding 841,000 new users.
Figure 8: DeFi user growth has seen an improvement in Q4 2021
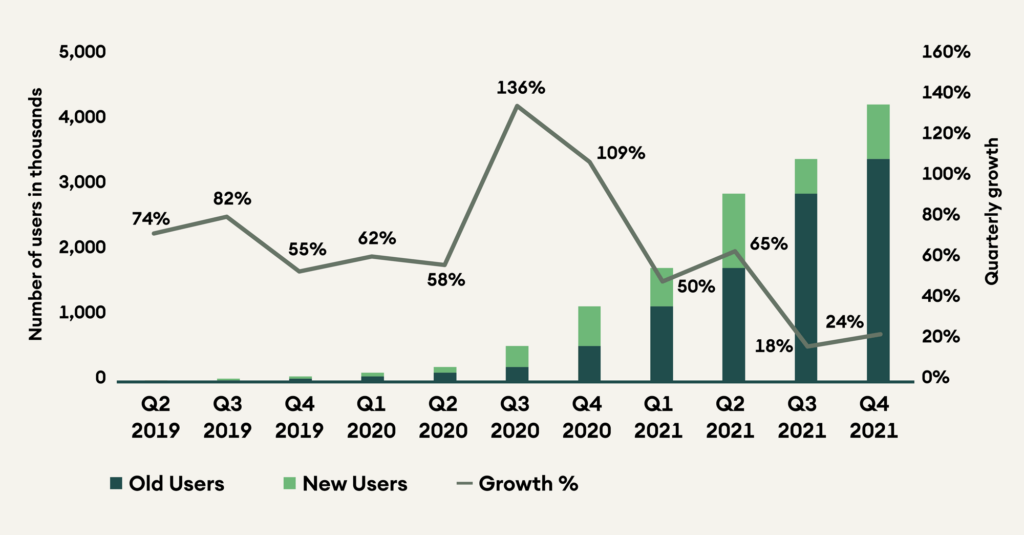
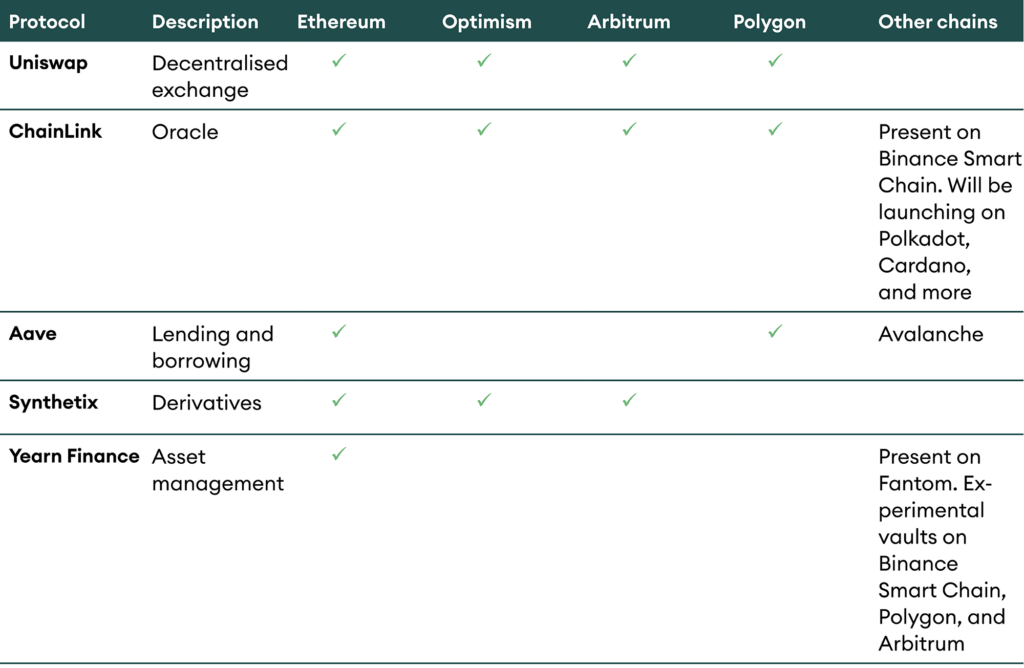
For DeFi to reach new highs in 2022, developers need to continue building and delivering product improvements. Projects are already pursuing a multi-chain strategy boosting user activity and revenues. Institutional adoption of DeFi platforms will be another catalyst for their growth.
Table 3: DeFi products are following the users and going multi-platform
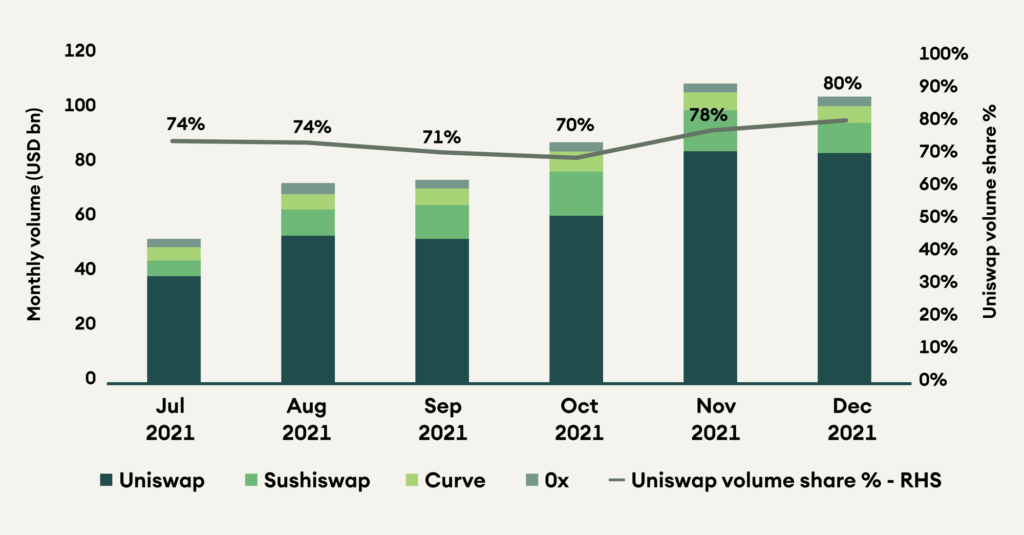
Uniswap launched their decentralised exchange on Polygon (MATIC), adding about USD 50 million to its daily volume. In December, Uniswap’s market share grew to 80%, among the top four decentralised exchanges on Ethereum.
Figure 9: Uniswap had monthly volumes of USD 85 billion with a market share of 80%
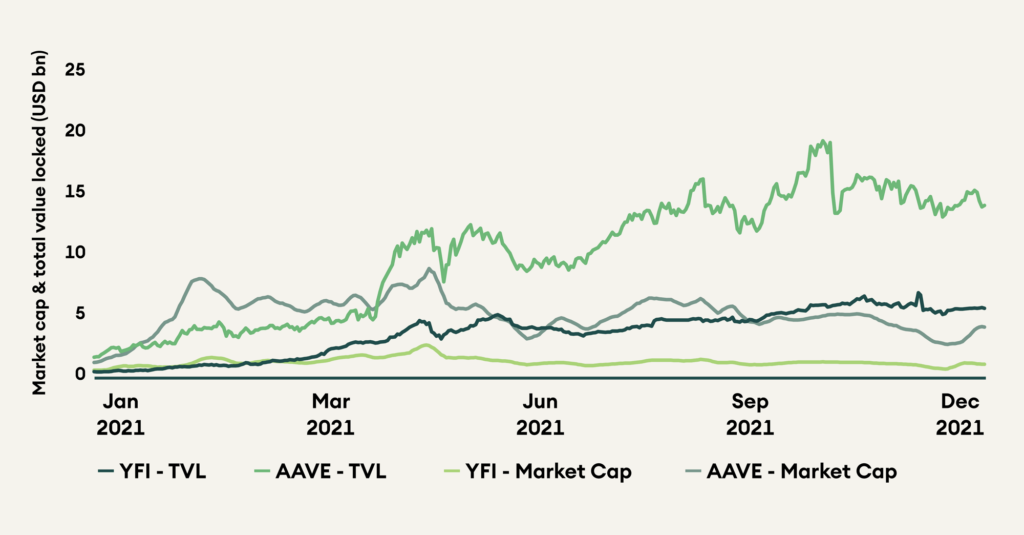
In the past two Digital Investors, we have noted how Aave and Yearn Finance have been trading at significant discounts to their earlier valuations. On the back of improvements in tokenomics and protocol buybacks from its treasury, Yearn Finance recovered in December.
Aave price remained broadly unchanged in December. Its v3 upgrade will provide higher capital efficiency for users and improved risk management for the protocol. A proposal to add AMINA Bank as a whitelister for Aave’s institutional platform, Aave Arc, has also been submitted. Further, the Aave team is building a social network and a mobile wallet, which will help onboard more users to their platform.
Both projects’ market capitalisation to total value locked ratio continues to stay depressed, indicating attractive valuations. Aave trades at 0.3, less than half of the yearly average of 0.7. Similarly, Yearn Finance trades at 0.2, less than half of its yearly average of 0.5.
Figure 10: YFI and AAVE TVL growth has outpaced market cap growth
Conclusion
2021 was an exciting year for cryptocurrencies as this asset class gradually entered mainstream consciousness and made new highs. There were ups and downs in crypto prices, but the upward trend has remained intact. Exciting new themes like DeFi, NFTs, metaverse, and stablecoins captured the attention of investors. At the beginning of 2022, the crypto ecosystem stands at a crucial juncture.
Payment chains are losing steam to the benefit of platform chains and stablecoins. We expect this trend to continue this year.
Among the platform, Ethereum is expected to finish its transition to ETH 2.0 and to offer new possibilities and better tokenomics. Polkadot and Cardano need to fulfil their promises. The number of applications to be developed on these platforms and the user growth will be determinant.
Finally, DeFi applications trade at cheap valuations after a mixed year. Developments in this sector may bring them back to light in 2022.