Executive Summary
September was a tumultuous month as good and bad news alternated. In the same month, bitcoin became legal tender in one country while another country banned all trading activities. In our view, bitcoin has shown enough resilience and maturity that adverse regulation, even from a large country like China, is more a speed bump than a death knell. On the positive side, Lightning Network is becoming the killer solution for micropayments as it was integrated for tipping on Twitter and adopted by millions of Salvadorans.
Ethereum now has almost 50% lower inflation because of the changes in tokenomics from EIP-1559 without any impact on security. While it has lost market share to competitors, it is trying to compete through scaling solutions that are in public betas but will fully roll out before the end of the year.
Polkadot will be getting parachain auctions in Q4 and should see significant interest, as the ones on Kusama have been very successful. Smart contracts launched on Cardano but ran into roadblocks because of the choices made in chain architecture.
Decentralised finance has been an underperformer over the past year. To capture a larger number of users, DeFi protocols are now diversified among different chains and scaling solutions. Integrations with NFTs and permissioned pools will be the next engines for growth for DeFi.
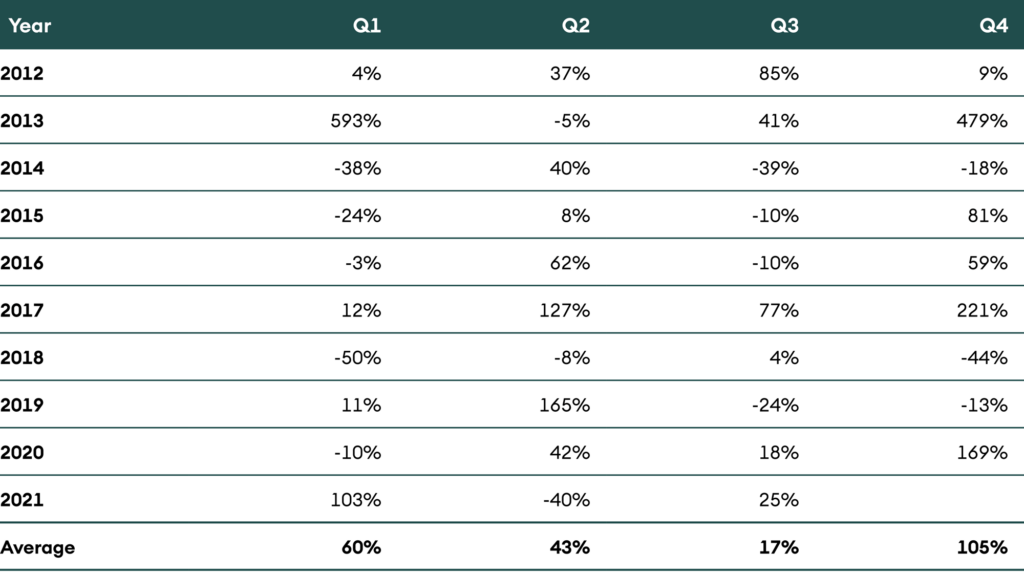
In the last nine years, Q4 has been a strong quarter for crypto assets. If history rhymes, the positive price action of the first days of the final quarter should set the tone for the months to come.
Table 1: Price performance in USD of the assets in coverage universe as of 30 September 2021
Introduction
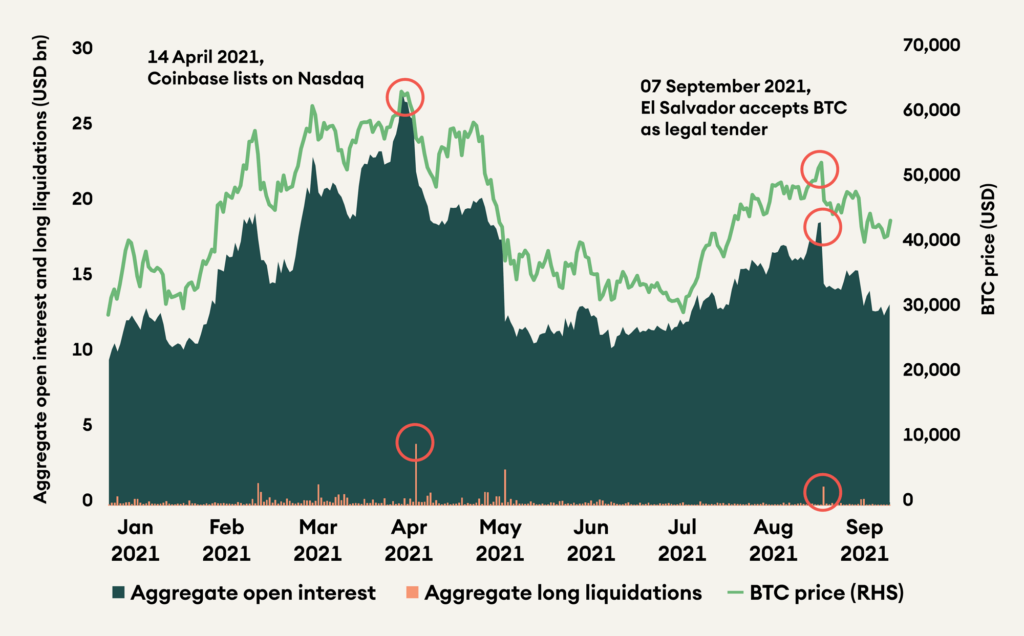
September was a tumultuous month as all digital assets closed in the red. Unsurprisingly, Bitcoin outperformed in a down market, losing only 7%. The markets started the month strong in anticipation of El Salvador adopting bitcoin as legal tender on 7 September, nicknamed “Bitcoin Day”. Bitcoin price increased above USD 50,000 on the day before crashing by 11% as traders “sold the news”. This is not the first time crypto overheats in the lead up to a positive event. One of the most prominent cases of this phenomenon was in the lead up to the Coinbase listing on 14 April, when bitcoin reached its all-time high at USD ~63,000, just the day before. The following days saw very high liquidations, and in the subsequent months, the bitcoin price declined by more than 50%, falling below USD 30,000 in July. It has recovered to USD 50,000 at the time of writing. We covered this phenomenon in our Crypto Market Monitor, “Sell the News”.
Figure 1: Open interest peaks in anticipation of good news; however, leads to high liquidations after the event
Bitcoin
In September, China extended the crypto ban to all digital asset trading activities. Since then, Huobi, an exchange focussing on China, has stopped opening new accounts from the region and will be closing accounts of all Mainland China users by 31 December 2021.
In our opinion, this setback should not have long term negative consequences. Bitcoin and other crypto assets are now global enough and well established in multiple friendly jurisdictions to digest such a setback, even from a big country like China. In our Digital Regulator, our publication monitoring global regulatory developments, we observe a clear trend towards regulating the rise of this new asset class, not banning it. Switzerland granted two banking licences to crypto banks, in the US where the crypto legal framework is unclear, Coinbase is listed on Nasdaq. Canada and several EU countries have ETP/ETF products of digital assets. The European Union is working on regulating the Markets in Crypto Assets (MiCA) and will implement a framework in two to three years.
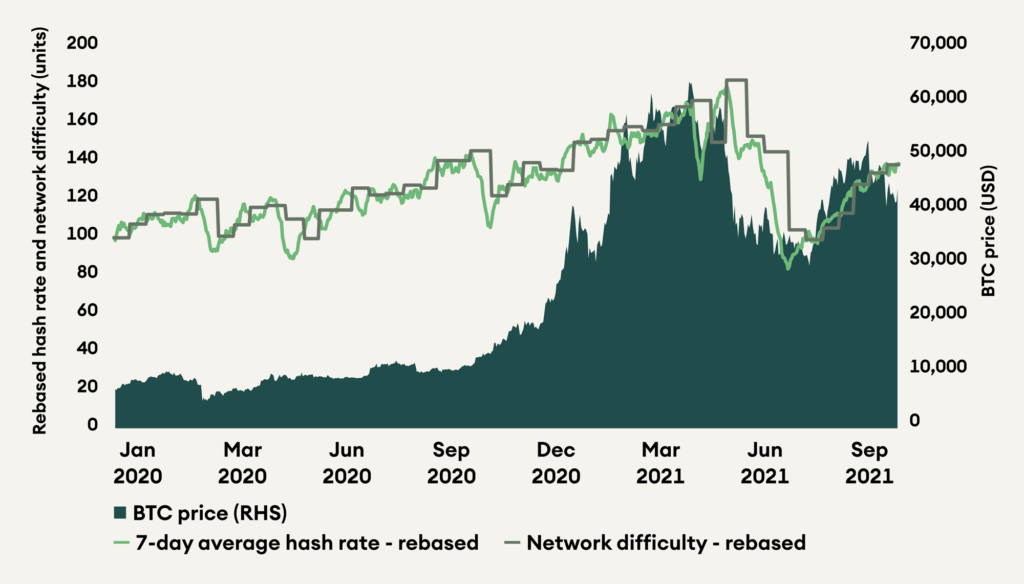
Whenever a government bans crypto, another capitalises on it. This is evident from how Bitcoin recovered after the Chinese mining ban. The miners have moved to friendlier jurisdictions, and hash rate and network difficulty have significantly recovered from the lows in July 2021. El Salvador also recently announced that it has started using clean geothermal energy to mine bitcoin as well.
Figure 2: Hash rate and network difficulty have recovered 50% from the bottom in July 2021
September was not all negative news. “Bitcoin Day” was historic as bitcoin became legal tender in El Salvador. Individuals in El Salvador shared pictures of them buying food or coffee at multi-national chains using bitcoin. The Salvadoran president, Nayib Bukele, announced that 2.1 million people were actively using the Chivo wallet. Last month also, Twitter integrated Lightning Network for users to tip each other. This is a significant development as it may encourage other large tech companies to incorporate crypto. Earlier, companies like Microsoft Xbox and Steam integrated Bitcoin as a payment solution, and recently Amazon published a job opening for a “Digital Currency and Blockchain Product Lead”.
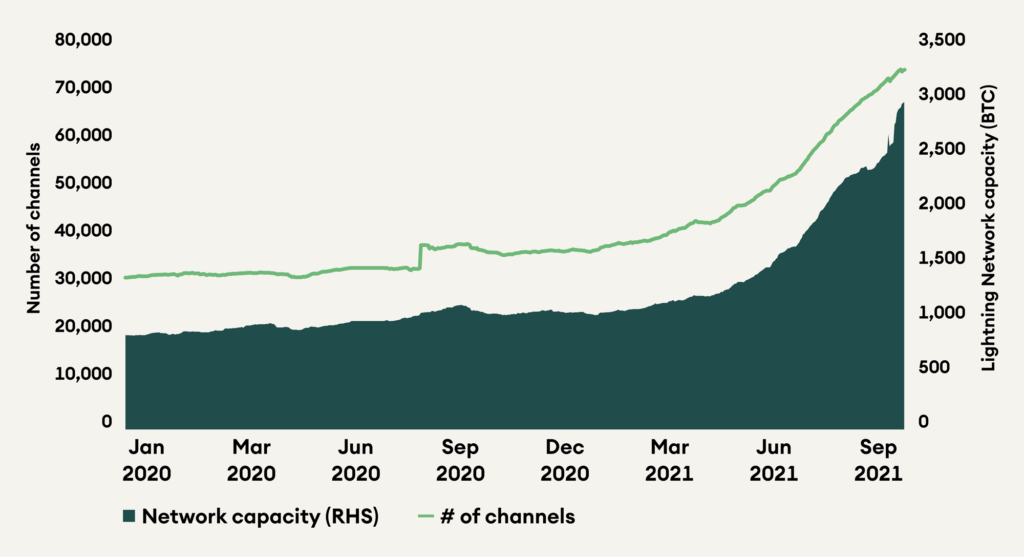
For small day-to-day transaction sizes, bitcoin’s layer-2 scaling solution, Lightning Network, is preferred. As a result of integration in El Salvador and Twitter tips, Lightning Network use is growing along with capacity. Scaling solutions like the Lightning Network are crucial for crypto assets to absorb global adoption. We will cover different scaling solutions in more detail in the upcoming publication of The Bridge.
Figure 3: Sharp increase in the number of open channels and bitcoin capacity on the Lightning Network
Other Payment Chains
Litecoin had an exciting month as well. Fake news broke out that Walmart entered a partnership with the coin and will allow LTC payments across its online and offline stores starting 1 October 2021. This news spread quickly, with major news outlets like Reuters and CNBC publishing it. However, Globe News Wire, the publisher of the news, was duped by a person using a “walmart-corp.com” email address that is owned by a domain squatter.
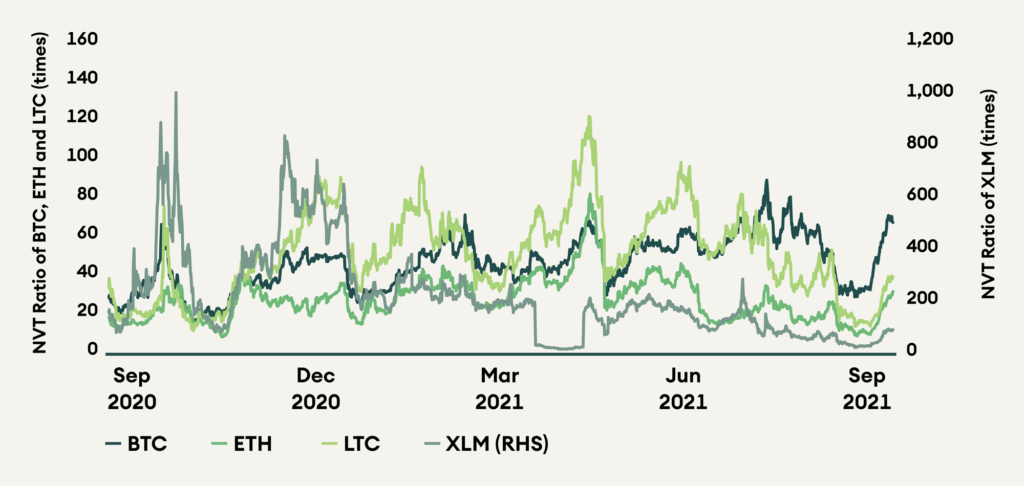
Revisiting the network value to transactions ratio or NVT ratio, we see a sharp improvement in the multiple for the payment chains Bitcoin, Litecoin, and Stellar, with the NVT ratio reducing further than the fall in price. For Ethereum, the NVT was unchanged if you exclude the price impact.
Figure 4: NVT ratios of coins were lower in September compared to August
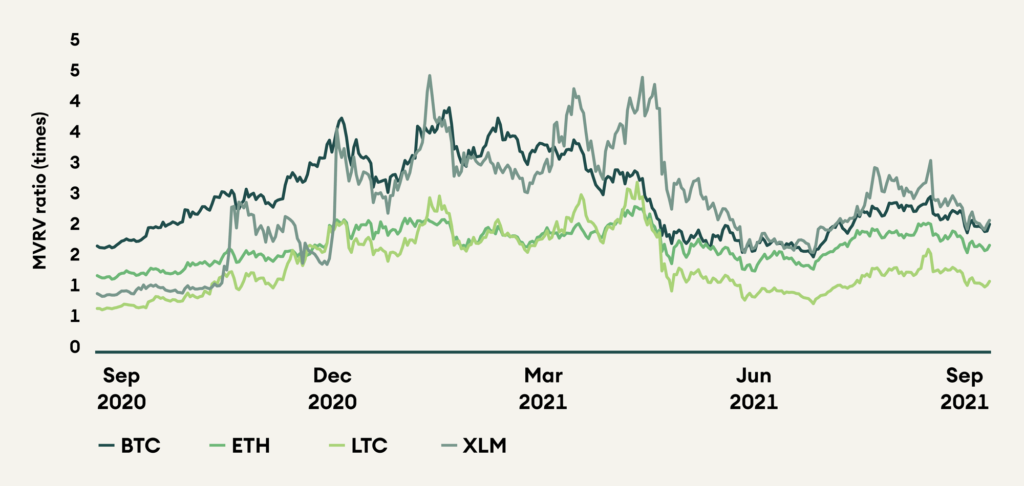
Market capitalisation to realised value ratio or MVRV ratio is a more behavioural indicator, unlike the NVT, which is a more fundamental indicator. MVRV measures the degree to which holders are in profit, with holders more likely to sell at higher levels because of the disposition effect found in behavioural finance, where investors are more likely to sell their winners and hold on to their losers. On an absolute basis, LTC is the cheapest, with an MVRV ratio of just 1.1, followed by ETH at 1.7. Both BTC and XLM have an MVRV ratio of 2.1.
Figure 5: MVRV ratios of all coins have fallen during September
Ethereum
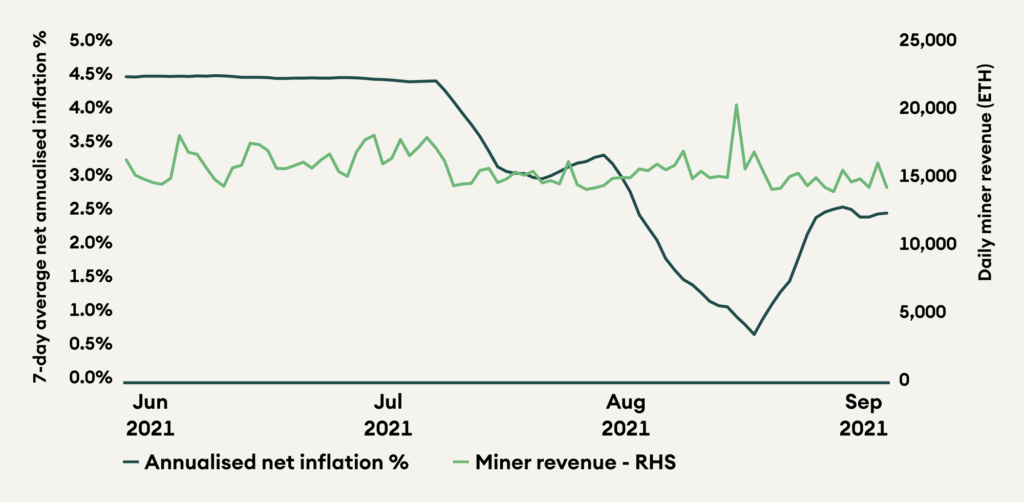
In August, Ethereum implemented its last significant upgrade, EIP-1559, which changed its tokenomics. With almost two months since the update, we can measure the impact it has had on net inflation. Before EIP-1559, approximately 14,000 ETH were issued daily. Since 5 August, the average daily issuance has dropped to ~7,500 ETH. Despite the reduction of ETH issuance, the security budget of Ethereum has barely changed as miner revenues fell by a mere 5% since the implementation of EIP-1559 compared to July 2021. This means that Ethereum is as secure as ever, and there is no reason for miners to be dissatisfied.
Figure 6: Ethereum’s net inflation has halved while miner revenues are not significantly affected
Inflation on Ethereum has an inverse relationship with the gas fee, with higher gas fees causing more burn and lower inflation. However, the high gas fee has also increased transaction costs making the blockchain more expensive to use. Let us take a moment to understand why gas prices are so high on Ethereum. Even as the gas fee is high, usage of the blockchain indicates that users continue to believe the benefit they derive from the transaction is greater than the transaction cost. Ethereum is the first and largest smart contract platform and has a culture of smart contract innovation. As new use cases for smart contracts are developed, they come first on Ethereum. This was seen in 2017 with ICOs, 2020 with DeFi and again this year with NFTs. As a new use case develops, early investors see huge returns on their capital. This brings new investors and new projects as it creates excitement around the new theme. Since investors expect a high return on capital, they are willing to pay a high transaction fee as the cost of doing business. However, since gas prices are the same across transaction sizes, slowly smaller investors get priced out. Other chains then give these users a cheaper way to invest by replicating the hot trend on their platforms.
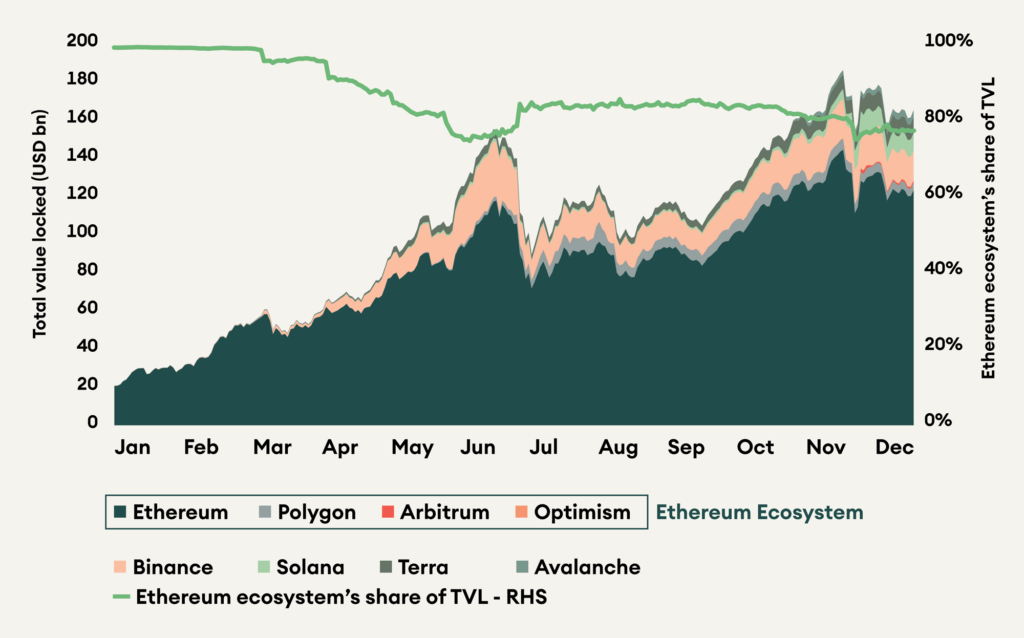
In 2021, competing platforms have gained traction as they have become more sophisticated, capturing an increasing share of users and developers through cheap fees and large incentive programs. As a result, Ethereum TVL (total value locked) market share has declined throughout the year, from 99% in early January to 77% in September. While scaling solutions like Polygon, Arbitrum, and Optimism provide a way for Ethereum to scale, their adoption is still at a fraction of other platforms. Arbitrum and Optimism are both in beta and do not yet have an incentives program, their market share should improve as they have a full release.
Figure 7: Ethereum is slowly losing market share to competing platforms
Other Platform Chains
Polkadot and Cardano, two competing platforms to Ethereum, are still at an early stage. Polkadot does not yet have smart contracts, and while Cardano does support them, there are no significant implementations yet.
For Polkadot, as usual, we look to its canary network, Kusama. Nine parachain auctions have successfully concluded on Kusama, with two more to finish in October. In the nine parachain auctions so far, 2 million KSM or USD 600 million have been locked, constituting almost 20% of the market cap. Extrapolated to Polkadot, that would mean USD 6 billion or 200 million DOT will be locked in nine parachain auctions. Polkadot parachain auctions are expected to start in Q4 2021 and are one of the key expected events of this quarter.
For Cardano, the Alonzo upgrade went live, bringing much-awaited smart contracts to the blockchain. However, issues at launch, along with the lack of developer tooling, underwhelmed the market. Currently, only prototypical smart contracts written by IOHK developers have been released, and Cardano would need a few more months to replicate the applications already present on Ethereum and other platform chains. At the annual Cardano Summit, IOHK announced significant partnerships. Cardano will be providing a digital identity solution for Dish Network’s customers, and ChainLink will be providing oracle services to the Cardano ecosystem.
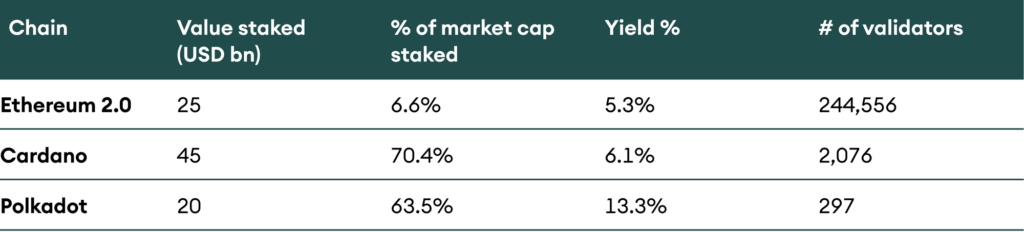
For proof-of-stake chains, stakers provide the vital service of securing the network instead of miners. Stakers lock their funds in the protocol and earn a yield as compensation. We compare Cardano, Polkadot and Ethereum 2.0 staking on four metrics in Table 2. The absolute value staked shows how much value is securing the network; Cardano has the highest and is, therefore, the most secure. For the percentage of market cap staked, since ADA and DOT do not have productive use of the token, the percentage of market cap locked is much higher than that of Ethereum. A higher yield means that stakers want higher compensation for locking their funds; Polkadot stakers earn the highest yield. The number of validators represents how decentralised the security is; however, this is inflated for Ethereum as it has a cap of 32 ETH per validator. Among the other two, Cardano leads with 7x the number of validators of Polkadot.
Table 2: Staking statistics of Ethereum, Cardano and Polkadot
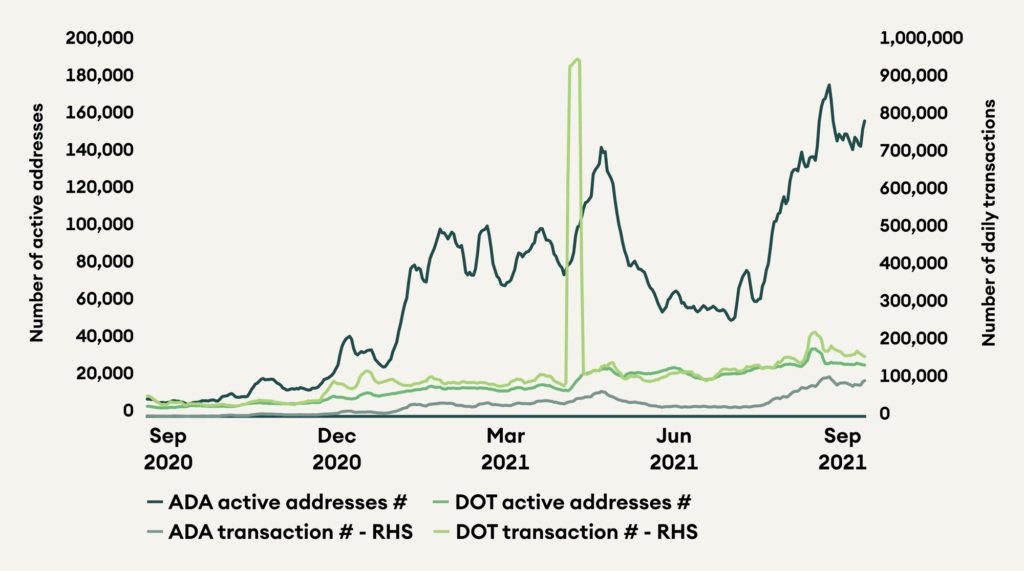
Cardano recorded a significant increase in on-chain activity. Average active addresses increased by 51% to 151,000, and the average number of transactions increased by 85% to 89,000. On the other hand, Polkadot saw a steady increase, with average active addresses rising by 12% to 30,000 and average transaction count increasing by 28% to 183,000.
Figure 8: Cardano and Polkadot saw increased activity on the platforms in September
Decentralised Finance
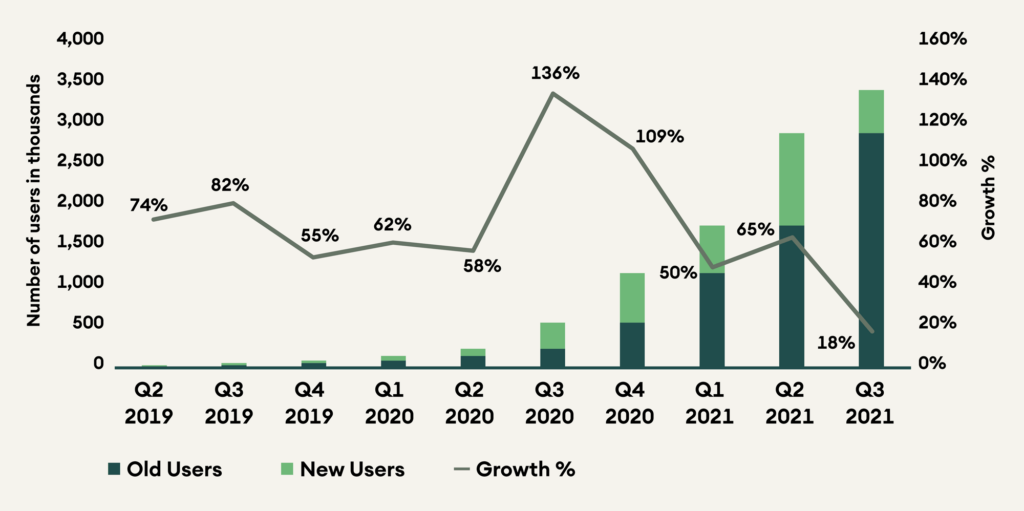
Decentralised finance (DeFi) on Ethereum has suffered for multiple reasons. Gas prices are elevated, non-fungible tokens have become the dominant theme, and as we covered in the latest Digital Regulator, there is a regulatory overhang. Consequently, user growth has slowed to only 18% growth in Q3 2021 compared to 65% in Q2 2021. DeFi on Ethereum added only 535,00 new users in Q3 2021, with a total user base of 3.4 million.
Figure 9: DeFi user growth on Ethereum has sharply fallen
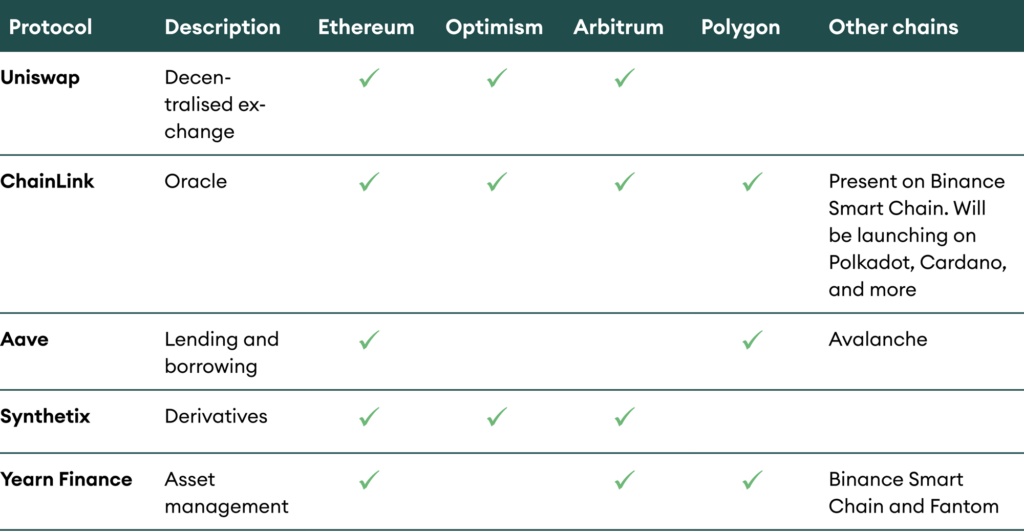
While the data above captures only users on Ethereum, all DeFi protocols under coverage have diversified to Ethereum scaling solutions or alternate platforms. Uniswap and Synthetix have beta products on Optimism and Arbitrum, Aave is on Polygon and Avalanche, Yearn Finance has experimental vaults on Arbitrum, Polygon, Binance Smart Chain and Fantom, and ChainLink is going to be platform agnostic with services already on Polygon, Binance Smart Chain and Arbitrum and plans to expand to other chains as well. The strategy of going horizontal across platforms makes a lot of sense for these products as it allows them to diversify and capitalise on the success of any chain. As users move to other platforms, they are likely to already associate with these brands, giving them an edge over newer players.
Table 3: DeFi products are following the users and going multi-platform
Despite the slowdown, the DeFi space is not dormant. Uniswap rolled out an update to its trade routing algorithm. Orders can now route through multiple liquidity pools to reduce slippage. This improvement is especially relevant for larger trades, where interacting with only one pool would cause a higher amount of slippage.
Aave is looking towards NFTs and institutional pools as its next growth engines. Founder, Stani Kulechov, announced that Aave is looking to integrate NFTs as collateral and build a social media platform connecting DeFi and NFTs. This is a win-win for Aave and NFTs as it makes NFTs productive assets by allowing holders to lend or borrow against them while Aave unlocks a new asset class. An Aave governance vote on institutional pools is proposed to make Fireblocks a whitelister for the institutions, which suggests that Aave Arc is around the corner.
Conclusion
September was a tumultuous month as good and bad news alternated. October has started on the right foot. We remain constructive in Q4 as adoption continues, and new developments are likely to create new opportunities. Scalability solutions are implemented, providing faster and cheaper transactions to end-users. In this context, the Lightning Network is an excellent example of how transformative scalability solutions are. Without it, El Salvador and Twitter would not be able to make bitcoin a unit for micropayments.
The rise of Ethereum alternative smart contract platforms, with their specificities and advantages, provide niches on which decentralised applications will grow. In addition, the integration of DeFi and NFT are likely to be beneficial for both these sectors. Finally, the creation of whitelisted DeFi platforms a la AAVE Arc potentially opens the door to financial institutions.
While past performance is not indicative of future results, it appears there is cyclicality in crypto asset price performance. Historically, the Bitcoin price performance is strong in Q4. On average, its price doubled (+105%) in the last nine years. If history repeats, Bitcoin price may finish the year at an all-time high to around USD 90,000.
Table 4: Quarterly returns of BTC in USD