Abstract
Crypto markets struggled through most of July but managed to close on a strong note, up by almost 13%. With the increase in prices, market sentiment has also buoyed. We present an analysis of the on-chain metrics to show whether the on-chain activity supports the rise in prices.
Bitcoin’s on-chain metrics show old holders are accumulating, and there is minimal growth in new users. NVT and MVRV ratios of payment coins are also close to their long-term averages suggesting fair valuations.
Ethereum, Polkadot, and Cardano will be going through significant upgrades in the coming months. The “London” hard fork will overhaul Ethereum’s monetary policy in August. Polkadot and Cardano will unlock greater functionality through parachains and smart contracts as they seek to build thriving ecosystems to rival Ethereum.
We also compare the concentration of DeFi tokens showing different holding patterns. Growth in the number of token holders for the protocols has stagnated, indicating a period of accumulation by old holders.
In conclusion, low on-chain activity and analysis suggest that we are at the beginning of the accumulation phase. The increase in prices may create a hype cycle and revive on-chain metrics, but there are no such indications.
Price performance
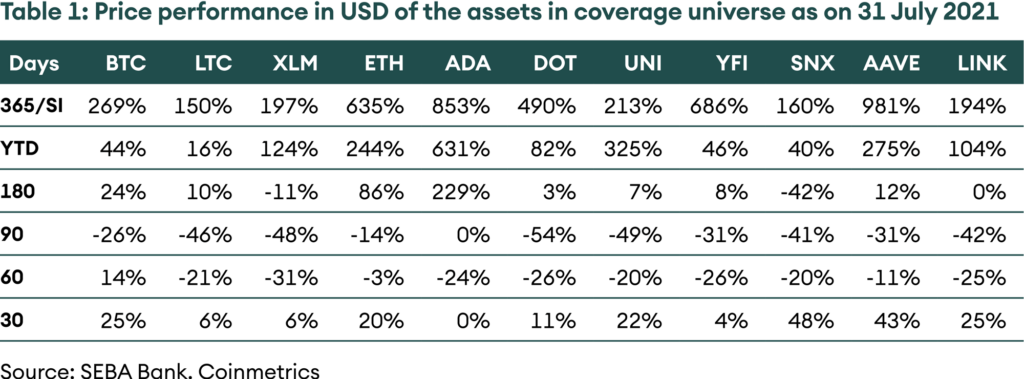
Table 1: Price performance in USD of the assets in coverage universe as of 31-Jul-2021
Introduction
Blockchains are a transparent and open means of value transfer, quite contrary to the recent comments by United States Senator Elizabeth Warren. Blockchain transaction data can be parsed and analysed to gain an insight into the collective actions and behaviour of the participants. Based on this information, we built on-chain models and indicators measuring adoption, use and ultimately, price developments. With the help of these on-chain analytics, we estimate where we stand in the current crypto cycle.
The crypto market suffered through most of July as performance remained muted. However, in the last week of July, there has been an uptick in prices and sentiment. In this edition of the New Digital Investor, we look at on-chain metrics of various blockchains and projects to see whether they support the uptick in prices or not.
Bitcoin and crypto market cycles tend to have two distinct phases. The first phase is a long accumulation when holders slowly build their positions, and the price action is muted. Distribution is the second phase when there is a massive amount of new interest, and the price increases sharply with old holders booking profits. On-chain metrics suggest that we are in the accumulation phase, and from here, two options are available. Either prices create enough hype for the on-chain metrics to revive and catch up or the other way round, prices consolidate to match the on-chain activity. Currently, we do not observe a firm improvement in on-chain activity.
The alt chains under active development like Ethereum, Polkadot and Cardano will significantly improve their protocols in upcoming months. However, it is unclear whether they will generate enough momentum by themselves for the market sentiment to improve. Historically, bitcoin has always led the pack and dominates market sentiment. It will be a first if these coins can decouple from the premier crypto asset and turn the tide for themselves and the rest of the market. We do not believe this is likely, and we remain cautious.
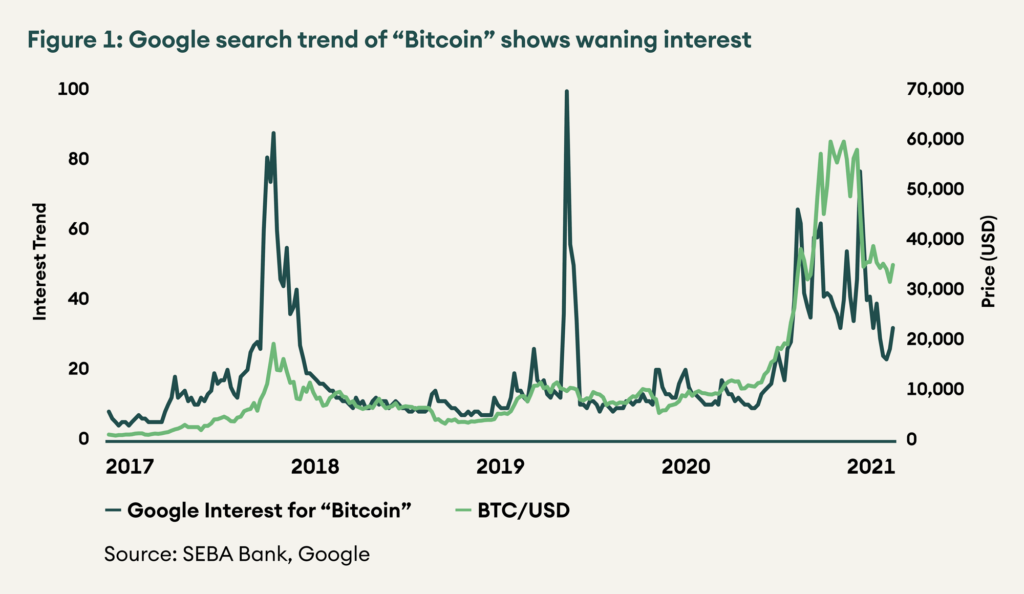
Figure 1: Google search trend of “Bitcoin” shows waning interest
Bitcoin
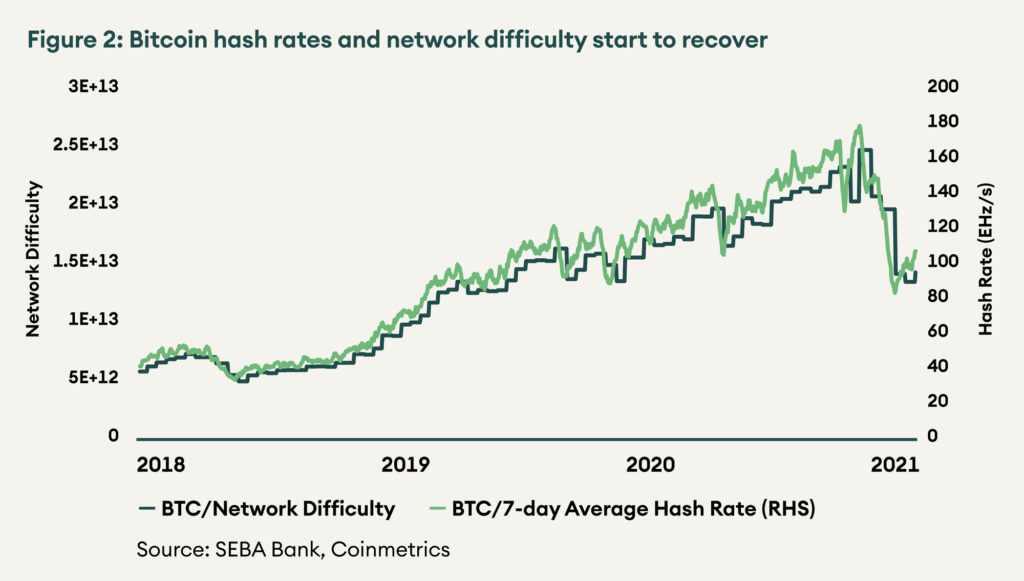
Bitcoin hash rate bottomed out at the beginning of July and has started rising again as the uprooted miners find shelter in Kazakhstan and the United States. Such a significant move with a minimal impact on the network proves how resistant it is to external threats. The decentralisation of Bitcoin mining is also a positive fundamental change that adds to its censorship resistance.
Figure 2: Bitcoin hash rates and network difficulty start to recover
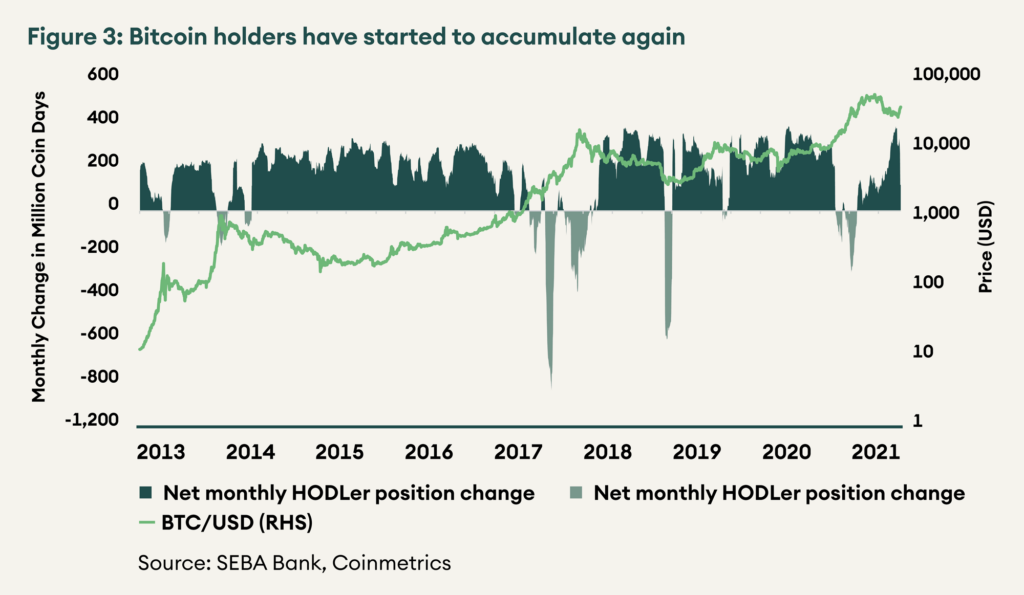
“HODLer net monthly position” is a metric derived from coin days destroyed1 and blockchain liveness. During the distribution phase with high prices, old coins move around as investors book profits and coin days are destroyed. During periods of accumulation, there is lower activity, and more coin days are added.
Figure 3 shows that the current cycle had a less extreme and shorter distribution period compared to earlier cycles. A lengthier consolidation, unlike the previous cycles with a blow-off top, also reflected this. Since the crash in May, we have wholly entered the accumulation phase with monthly change in coin days returning to historical highs. The accumulation phase usually happens after the cycle top is entirely behind, as seen after the 2014 and 2018 market cycle tops.
Figure 3: Bitcoin holders have started to accumulate again
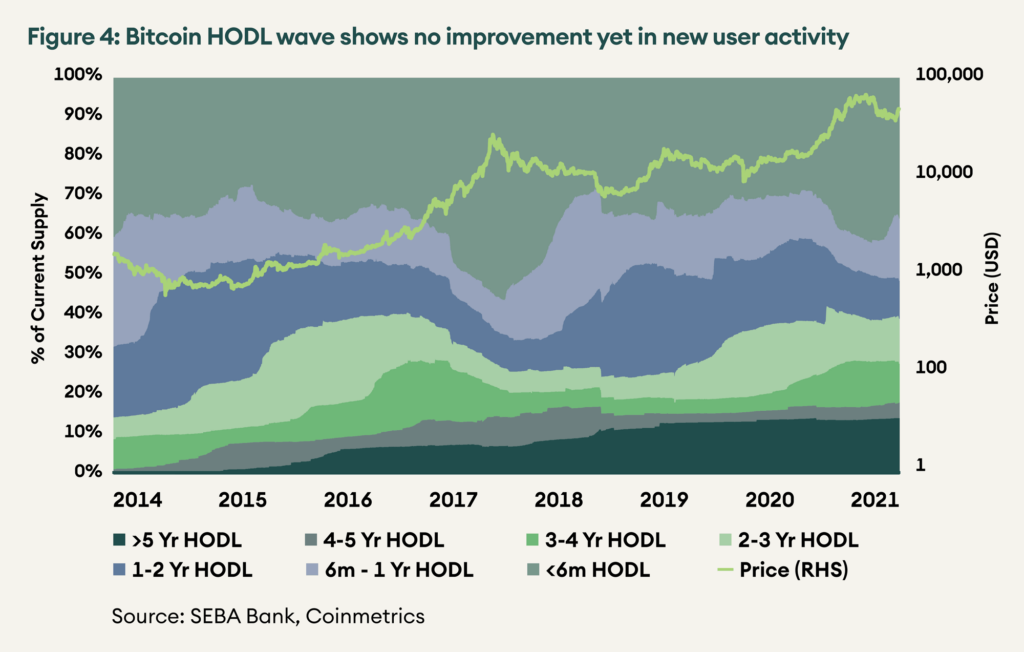
The HODL wave also shows a similar story where the distribution to new addresses has topped off, and the accumulation phase of old addresses has started again. Figure 4 shows how price movement is directly related to new user growth. There is no indication of new users joining in the recent months.
Figure 4: Bitcoin HODL wave shows no improvement yet in new user activity
Other Payment Chains
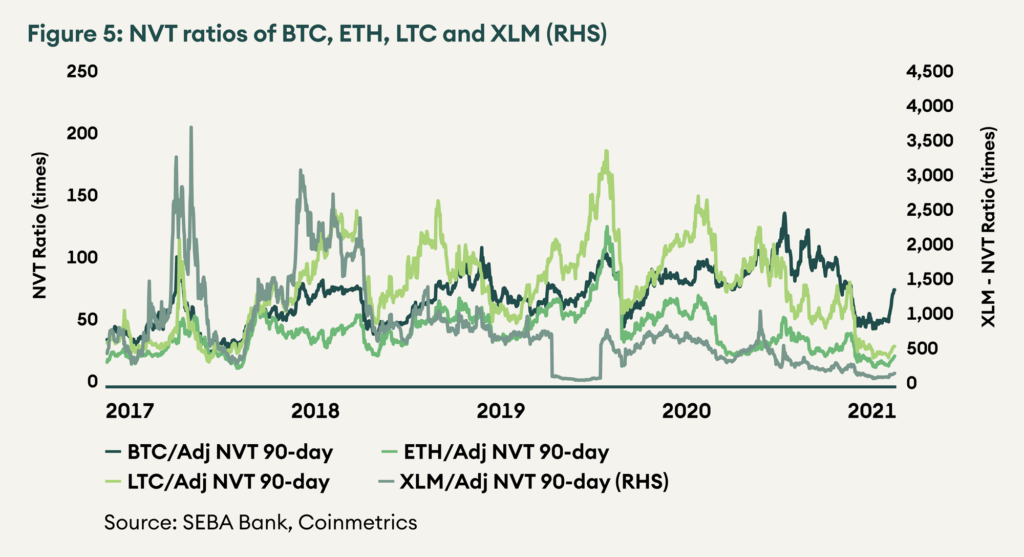
The primary use of payment tokens is to settle value among the network participants. The network value to transactions ratio or NVT ratio compares the market capitalisation of a coin to the transaction value settled. Similar to a PE ratio, a higher NVT ratio indicates that the coin is highly valued, while a lower NVT ratio means the coin is undervalued.
Figure 5 compares the NVT ratios of the top payment coins and ether, which may not be strictly a payment coin, but its extensive network, wide acceptance, and time spent in the top 5 ranks qualifies it as a medium of exchange.
Relative to their histories, all payment coins are undervalued according to the NVT metric. For BTC, the NVT ratio is less than one standard deviation below the two-year average; for ETH, LTC and XLM, it is more than one standard deviation below the two-year average. ETH and LTC look relatively more attractive with NVT ratios of 24 and 32, respectively, whereas XLM and BTC are more expensive with NVT ratios of 175 and 78.
Figure 5: NVT ratios of BTC, ETH, LTC and XLM (RHS)
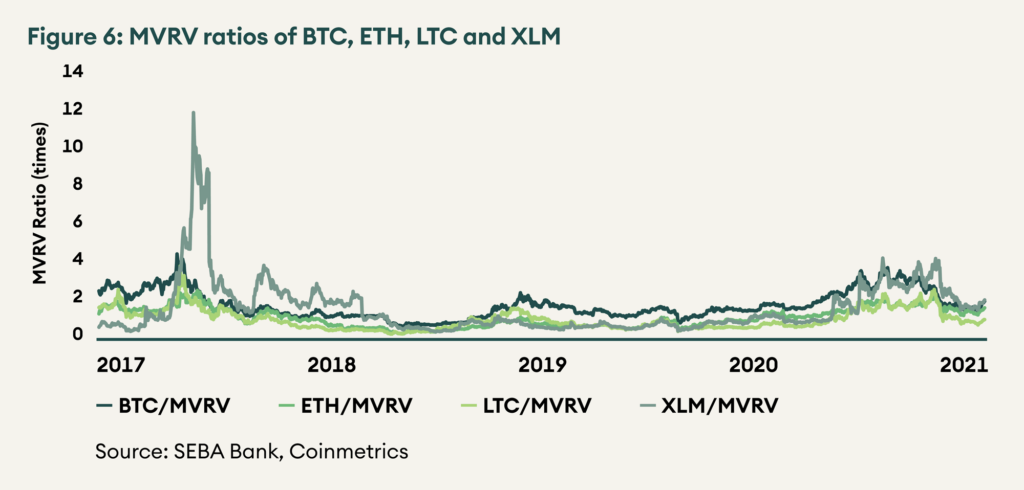
The realised value metric sums up the value of all bitcoins at the price they were last moved. Market capitalisation to realised value (MVRV) metric measures the degree to which holders are in profit. At higher levels, holders are likely to take profits and selling pressure is expected. In contrast, holders are expected to hold onto their coins at lower levels, and there is lower selling pressure.
LTC MVRV ratio is the lowest at 1.08, meaning holders are only at 8% profit on average. It is followed by ETH at 1.73 and BTC at 2.10. XLM has the highest MVRV ratio at 2.16. MVRV ratios of all four coins are above their two-year average, and ETH is the only coin with MVRV more than one standard deviation above the two-year mean. As per the MVRV metrics, payment tokens are fairly valued, and ETH is slightly expensive compared to its historical levels.
Figure 6: MVRV ratios of BTC, ETH, LTC and XLM
Ethereum
One of the most awaited updates to the Ethereum network is Ethereum Improvement Proposal 1559 (EIP-1559). It will be live on August 5 with the “London” upgrade. After implementing EIP-1559, the network will algorithmically determine the gas price instead of users exercising their discretion and overpaying or having to wait a long time. In addition, the network will also burn the base fees paid by the users instead of transferring them to the miners. Consequently, EIP-1559 aligns the interests of developers, holders, and users of the protocol as the more the network is used, the more ether is burnt, making it scarcer and more valuable. To read more about EIP-1559, please refer to the linked Crypto Market Monitor.
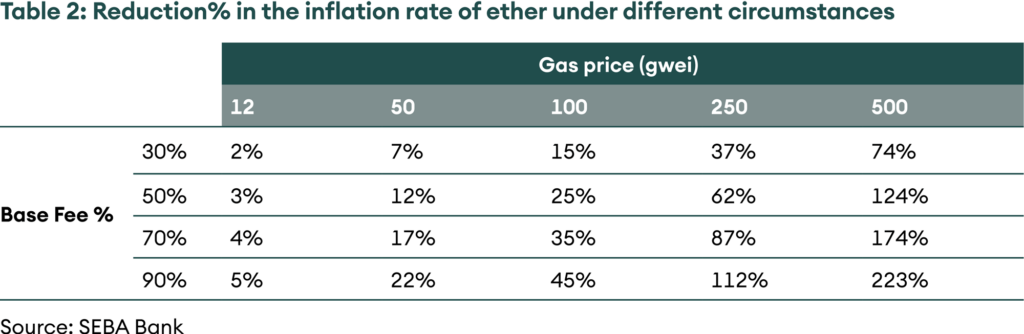
Currently, Ethereum has an annual inflation rate of ~4.5%, of which more than 90% comes from proof-of-work block and uncle rewards paid to miners and the rest as proof-of-stake inflation paid to validators for the Ethereum 2.0 beacon chain. After EIP-1559, the net annual inflation of ether will be lower by the amount of ether burnt. This is a function of two variables – the gas price or the demand of the network and the split between base fee versus miner tip, i.e., the split between retail users versus sophisticated users and arbitrage bots. Table 1 shows the impact of EIP-1559 on the inflation of ether under different conditions. For context, the average gas price in 2021 has been ~105 gwei, and if there is a 70% split between base fee and tips, it would mean lower net inflation by ~35%, down to ~3% from ~4.5%.
Table 2: Reduction% in the inflation rate of ether under different circumstances
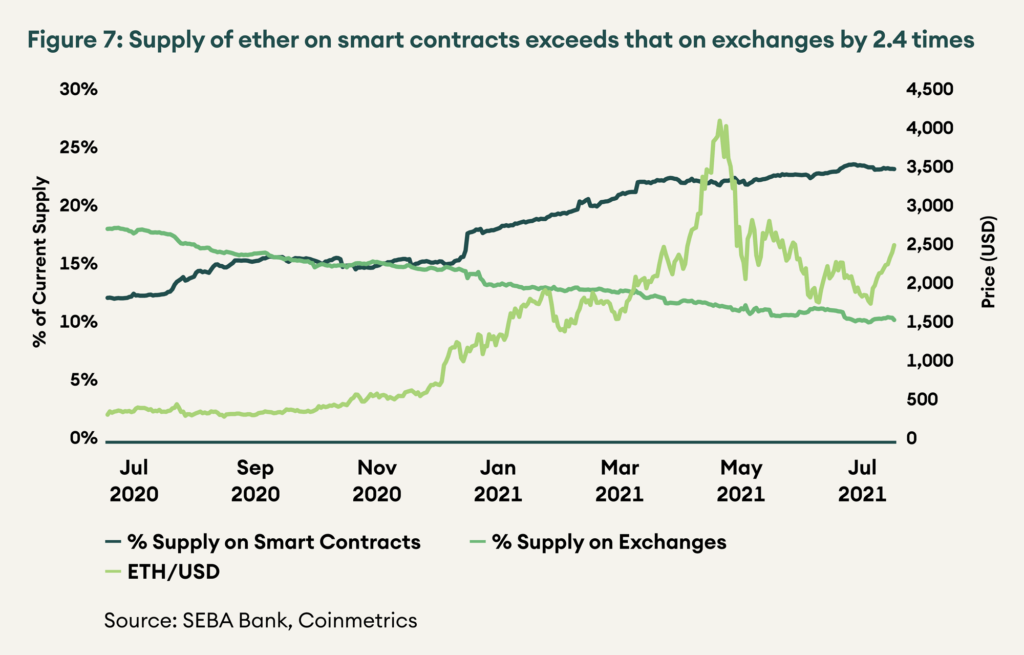
Another indicator for a platform chain like Ethereum is the comparison of supply on smart contracts versus that on exchanges, i.e., how much ether is being productively used on chain in the decentralised applications (dapps) it enables, versus the supply on exchanges that may be more for speculation. This has seen a consistent improvement for Ethereum as more and more ethers are moving from exchanges to smart contracts, as seen in Figure 7.
Figure 7: Supply of ether on smart contracts exceeds that on exchanges by 2.4 times
Other Platform Chains
Polkadot and Cardano are both going through a development phase, after which they will unlock new and broad use cases and look to capture user attention. For Polkadot, we look to its Canary Network, Kusama. Kusama parachain auctions have successfully concluded in July. Five promising parachains will bring decentralised finance (DeFi), computational cloud services, staking liquidity, cross-chain bridges and more to the Kusama ecosystem. After a period of testing on Kusama, parachain auctions are expected to go live on Polkadot too.
For Cardano, smart contracts are being tested on the Alonzo test net. Alonzo phase-1 concluded successfully in July and has transitioned to phase-2. After three more phases, smart contracts are expected to go live on the main net in Q4 2021. In August, basic dapps such as a decentralised automated market maker like Uniswap and a collateral-backed stable coin like Dai will be tested. The Alonzo rollout is currently running behind schedule, and a smooth phase-2 will be essential to ensure that it is not further delayed.
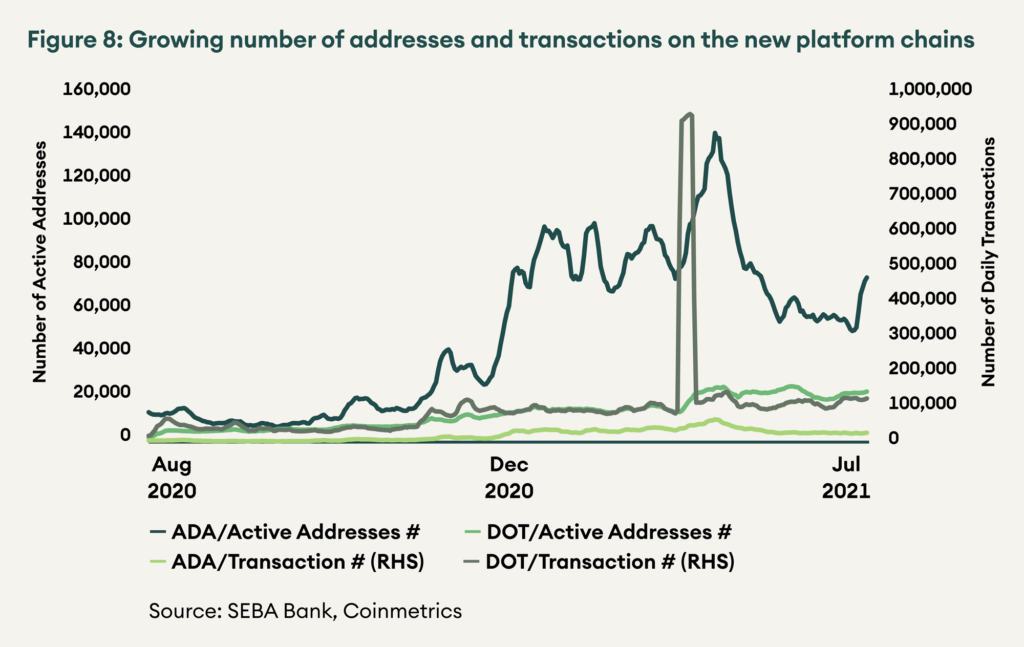
Until these upgrades go live, we can only compare the adoption and interest in the two chains by looking at the number of active addresses and daily transactions (see figure 8). In July, Cardano counted more active addresses than Polkadot, respectively 58,000 and 22,000. However, Polkadot recorded more transactions with 116,000 versus 27,000 for Cardano.
Figure 8: Growing number of addresses and transactions on the new platform chains
Decentralised Finance
DeFi has so far avoided regulation, but with the proposed Infrastructure Bill in the United States and comments from the Securities and Exchange Commission Chair Gensler, it seems like this may be coming to an end. We will cover the potential impact of such regulation in an upcoming Digital Regulator.
Following these updates, Uniswap Labs has delisted synthetic tokens like Synthetix’s sETH, sBTC, sAAPL from the website – app.uniswap.org. In this case, it is crucial to understand that Uniswap Labs, a company based out of the United States and subject to the United States law, is different from the Uniswap protocol, a smart contract hosted on the Ethereum blockchain governed by UNI token holders. Uniswap Labs is a contributor to the Uniswap protocol and runs the website (app.uniswap.org). Uniswap Labs can only remove the securities from the specific front end they control. Users can still use other front ends that integrate Uniswap protocol like 1inch, Zapper and Zerion or even interact directly with the smart contract to trade any liquid tokens. The Uniswap protocol is an immutable smart contract that runs on the Ethereum blockchain, and no entity can delist any tokens even if they wanted to. As long as the Ethereum blockchain has users and miners, the smart contracts it supports will continue to run.
Uniswap governance had approved a USD 20 mn DeFi Education Fund in June. The fund’s goals are to challenge misguided policies by funding DeFi education among policymakers, thought leadership and research, and advocacy of DeFi at a grassroots level. It will be crucial for the survival and growth of this still nascent industry that legislators take a more nuanced approach. Proactive initiatives such as the DeFi Education Fund will go a long way in helping towards that goal.
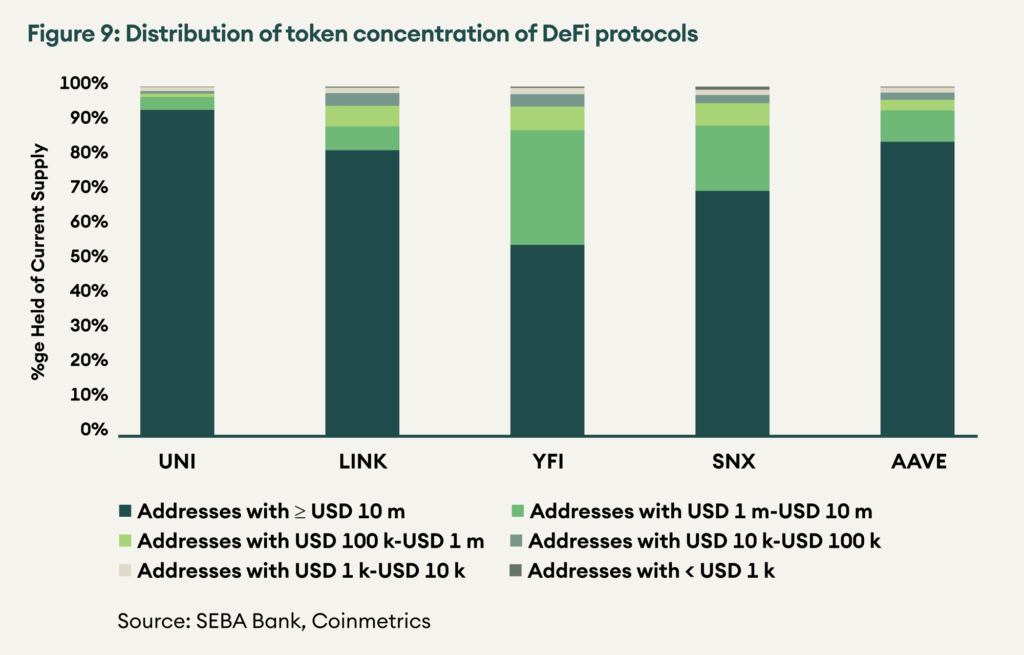
We have covered fundamental value drivers of DeFi dapps like total value locked for money markets and yield aggregators; volumes for decentralised exchanges in the previous Digital Investor. Another interesting aspect of dapps tokens that can be analysed is their distribution metrics. Dapp tokens can have varying degrees of concentration depending on age, original distribution method (ICO, liquidity mining, or airdrop), tokenomics, protocol treasury size and other market factors. Figure 9 shows that tokens with significant protocol and foundation treasuries like UNI and LINK have a higher concentration among large holders. YFI has the lowest concentration as a consequence of its free and fair launch. Usually, tokens with higher concentration can run up much higher without seeing a significant increase in selling pressure as large holders are usually insiders whose holding period is longer than that of speculators. However, highly concentrated tokens also bear the risk of the price being subject to manipulation if the large holders wish to do so.
Figure 9: Distribution of token concentration of DeFi protocols
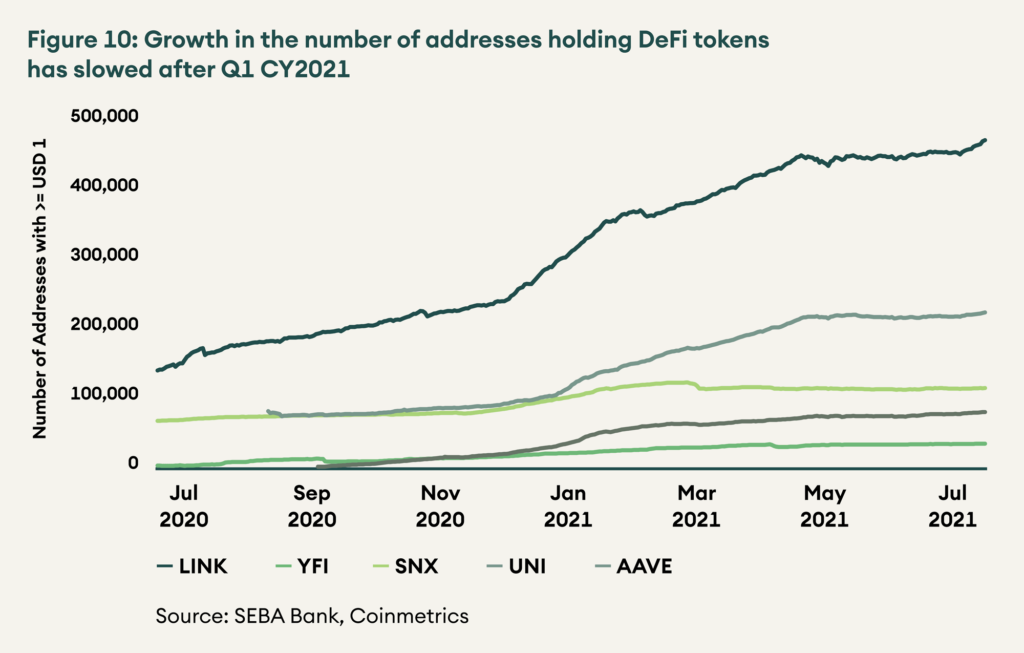
The number of holders is also an important metric to consider. A larger investor base signifies greater awareness of the project and a stronger brand. Similar to token concentration, age, original distribution method, tokenomics and other market factors may affect how many holders a token may have. This is an important indicator as a sharp increase in the number of holders may signify euphoria in the market. LINK has the highest number of token holders, and YFI has the fewest. The token holder base has not grown significantly in the recent months for all five projects. There was an average increase of 4% in July and 1% in June compared to 41% and 26% in January and February 2021.
Figure 10: Growth in the number of addresses holding DeFi tokens has slowed after Q1 CY2021
Conclusion
On-chain metrics suggest that we are in the accumulation phase, and from here, two options are available. Either prices create enough hype for the on-chain metrics to revive and catch up or the other way round, prices consolidate to match the on-chain activity. Currently, we do not observe a firm improvement in on-chain activity.
The alt chains under active development like Ethereum, Polkadot and Cardano will significantly improve their protocols in upcoming months. However, it is unclear whether they will generate enough momentum by themselves for the market sentiment to improve. Historically, bitcoin has always led the pack and dominates market sentiment. It will be a first if these coins can decouple from the premier crypto asset and turn the tide for themselves and the rest of the market. We do not believe this is likely, and we remain cautious.
1“Coin days destroyed” measures the number of days a coin has been held before it is sold. For instance, 2 bitcoins held for 60 days and then sold is equivalent to 120 coin days destroyed. ↵