Executive Summary
In the previous edition of The Digital Investor, we noted that platform chains had significant developmental upgrades coming up while Bitcoin’s on-chain fundamentals looked weak. Over the past month, we saw this play out as upgrades to Ethereum, Cardano, and Polkadot lifted the entire market. Bitcoin and payment coins underperformed as demand for their networks has not increased. Decentralised finance is also going through a building phase as investor mania has moved on to non-fungible tokens.
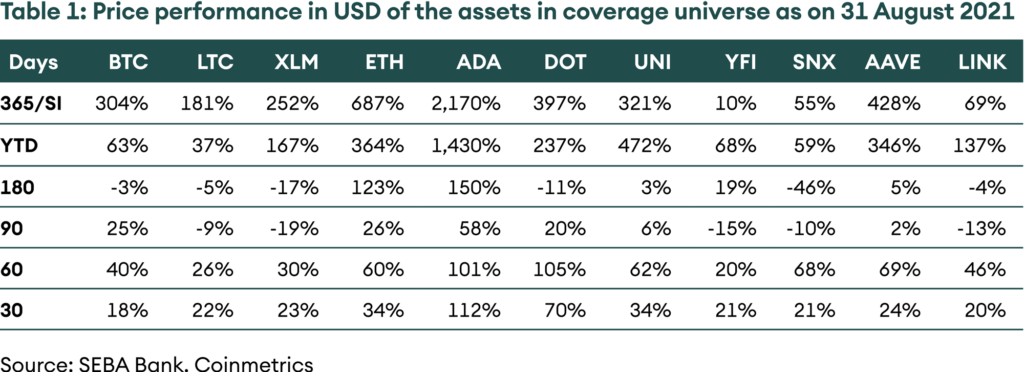
Table 1: Price performance in USD of the assets in coverage universe as of 31 August 2021
Introduction
August was another strong month for the market as it built on the momentum from July. All coins in our coverage universe gave positive returns, but the returns varied significantly across sectors. Platform chains have outperformed for the month and the year as new use cases are unlocked on these chains. Ethereum is the leader in innovation, but the base layer cannot keep up with demand. As a result, there are a growing number of challengers to its supremacy. Cardano, Polkadot, Solana and Avalanche have gained user and mind share as Ethereum struggles under prohibitively high gas prices.
Payment chains and decentralised finance (DeFi) tokens have been the underperformers. They suffer from similar problems as user activity has slowed and more dominating themes, platform chains and non-fungible tokens, are capturing more investor attention. For DeFi, regulatory uncertainty also casts a shadow over the space.
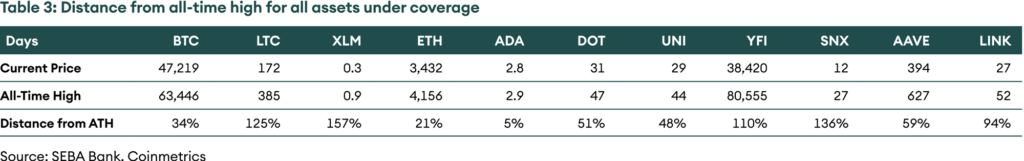
This edition of Digital Investor notes how Bitcoin has recovered significantly from the fall, lifting hopes that the cycle top is not yet behind. We look at the past to decipher the future and see that the 2021 cycle rhymes with the 2013 cycle. If the similarities continue, we can look forward to another all-time high later this year. At the end of August, Bitcoin trades only 34% away from the all-time high before going into price discovery mode. A strong September will complete a recovery quarter and set the pace for new highs in Q4 2021. Platform chains are much closer to their all-time highs and have more substantial tailwinds as new developments are on the horizon. DeFi is the furthest away and will need to innovate to capture user attention again.
Bitcoin
Bitcoin led the pack in July with the highest gains of all layer-1 protocols; however, we saw very little activity on-chain and minimal user growth. In August, it was the worst performer of all the assets under coverage with +18%.
However, it has recovered significantly from the lows and this cycle is starting to resemble the double top cycle in 2013 more than the 2017 cycle. In 2013, bitcoin set a new top in April, only to crash 70% by July. After that, it went on to recover and make a new cycle top in November 2013. This year too, bitcoin peaked in April and bottomed in July. If the similarities from 2013 continue, we may see a blow-off top later this year.
Figure 1: Bitcoin price movement in 2021 is similar to the movement in 2013
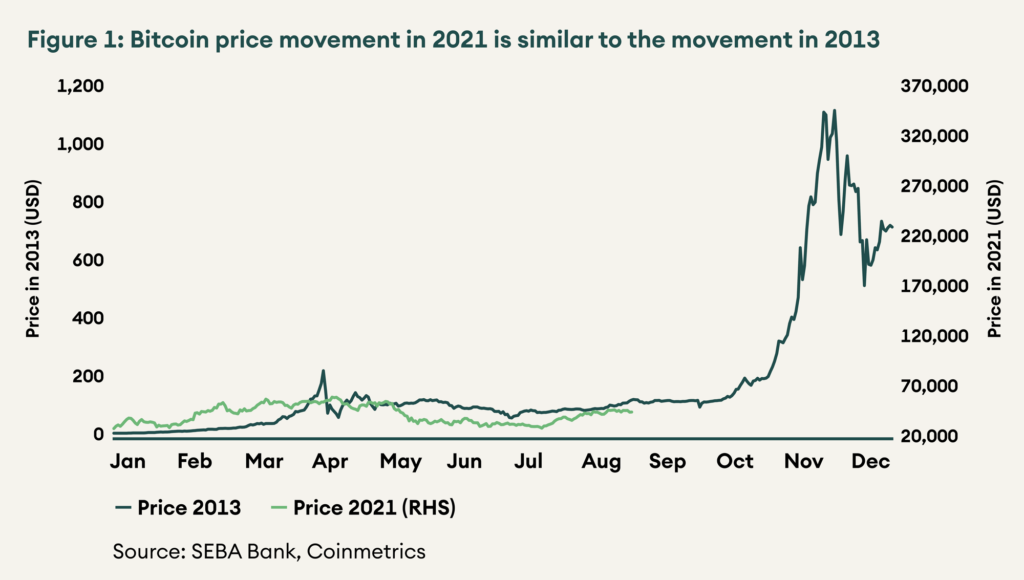
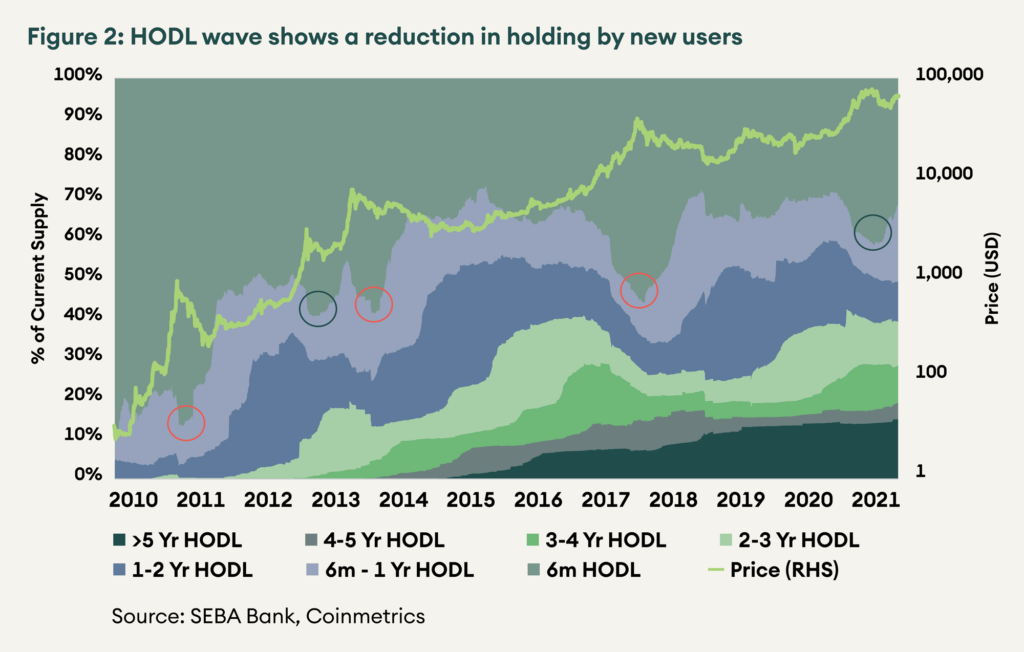
Figure 2 shows the Bitcoin HODL wave, an excellent metric to see how the network is growing and whether new users are buying bitcoin. This is important as there seems to be a direct relationship between price and new user activity. For August 2021, the percentage of circulating supply held by new users (less than six months) reduced from 35.4% to 31.7%.
However, the fall in new user holding is similar to mid-2013, with a more gradual reduction in holding by new users. For 2021 as well, the decline in the holding of new users is less sharp than other cycles. The green circles show this more gradual decline. The red circles show a sharp decrease in new user holding after a cycle top.
Figure 2: HODL wave shows a reduction in holding by new users
Other Payment Chains
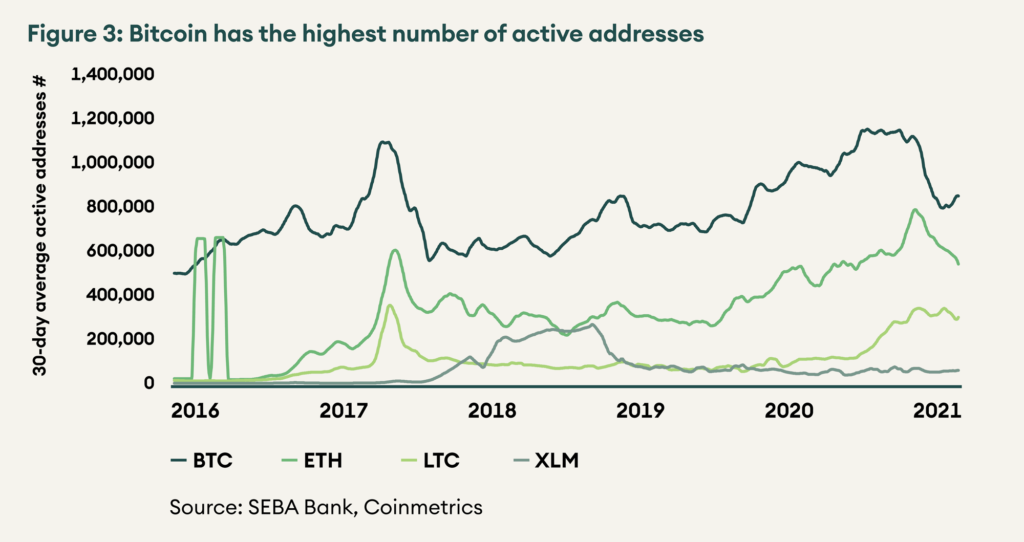
Litecoin and Stellar Lumens were also steady performers for the month. Payment chains derive value from the number of users they have and how much value they settle. Therefore, we compare the number of active addresses and the value settled on-chain. Please note that we include Ethereum in all comparisons for payments chains even though it is a platform chain. This is because its extensive network, wide acceptance, and time spent in the top 5 ranks qualifies it as a medium of exchange.
Figure 3 compares the absolute number of active addresses, which can be used as a proxy for the number of users. Bitcoin has the highest number of active users at ~850,000, followed by Ethereum at ~550,000 and Litecoin at ~300,000. Stellar has the lowest number of active users at only ~60,000.
Figure 3: Bitcoin has the highest number of active addresses
The network value to transaction ratio or NVT ratio compares the market cap to the value settled in native units on-chain. Like a PE ratio, a higher NVT ratio indicates that the coin is priced higher than the value it settles, while a lower NVT ratio means the coin is priced lower
The network value to transaction ratio or NVT ratio compares the market cap to the value settled in native units on-chain. Like a PE ratio, a higher NVT ratio indicates that the coin is priced higher than the value it settles, while a lower NVT ratio means the coin is priced lower
Figure 4: NVT ratios of all coins continues to rise in August
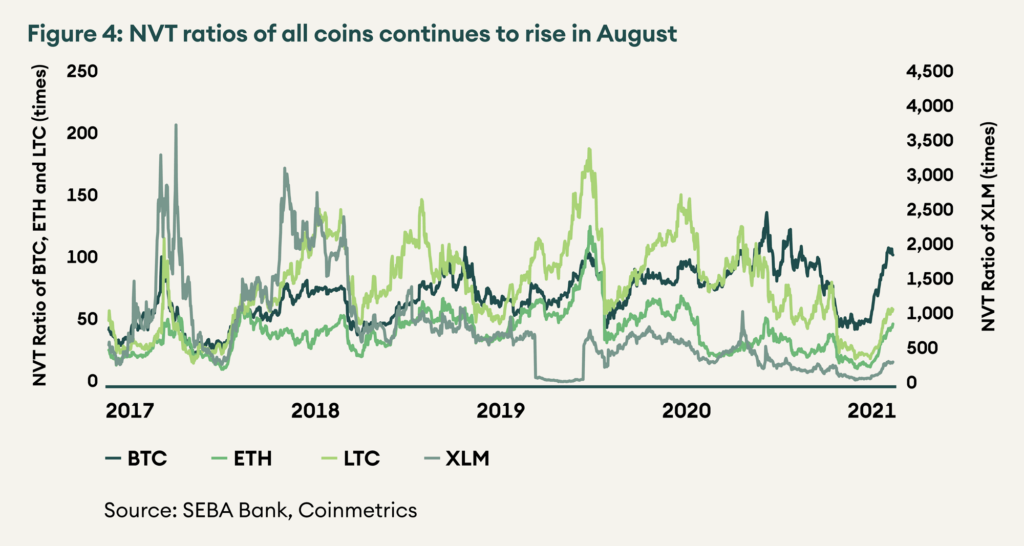
NVT ratios have risen sharply in August, and bitcoin and ether are now more expensive than their four-year averages. Litecoin and lumen still trade below their four-year averages. Ether is still the cheapest between the coins with an NVT of 51, followed by litecoin at 62. Bitcoin trades at an NVT ratio of 107, while lumen is the most expensive, with an NVT ratio of 358.
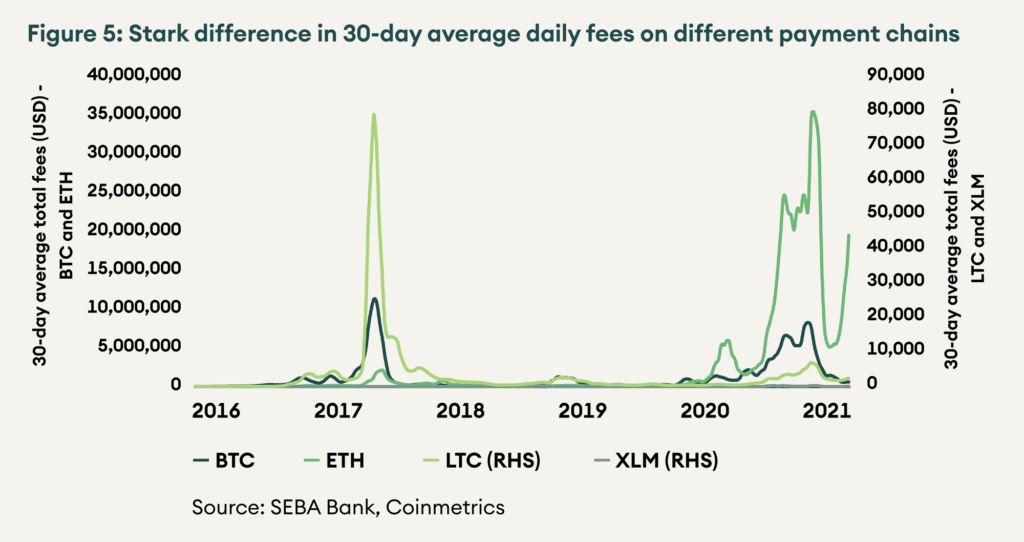
Total fees earned is also an important metric. It shows how much economic value the users are deriving from conducting the transactions on-chain. The difference here is very stark. 30-day average fees on Ethereum and Bitcoin are USD ~20 million and USD ~6 million, respectively. However, for Litecoin and Stellar, the daily fees are a paltry USD ~2,500 and USD ~70. Fees on Ethereum have eclipsed fees on Bitcoin since the second half of 2020.
Figure 5: Stark difference in 30-day average daily fees on different payment chains
Ethereum
August saw the launch of the much-awaited launch EIP-1559 for Ethereum. There had been concerns that miners may not support it, and there may be a fork if it goes live as they control the hash power. However, the “London” upgrade happened smoothly and has made a significant change to the monetary policy and incentive structure for Ethereum.
As discussed previously, EIP-1559 makes it so that the network burns a part of the fees that were previously going to the miners. As a result, the supply of Ethereum reduces every time a transaction happens on-chain. How much supply is burnt depends on the prevailing gas price. As NFT season is in full swing, gas prices on Ethereum have stayed elevated, and as a result, more than 200,000 ETH has been burnt. This constitutes a reduction in proof-of-work inflation by almost 50%. Ethereum has quietly had its own halvening.
Figure 6: Proof-of-work issuance is down by almost 50% since the London hard fork
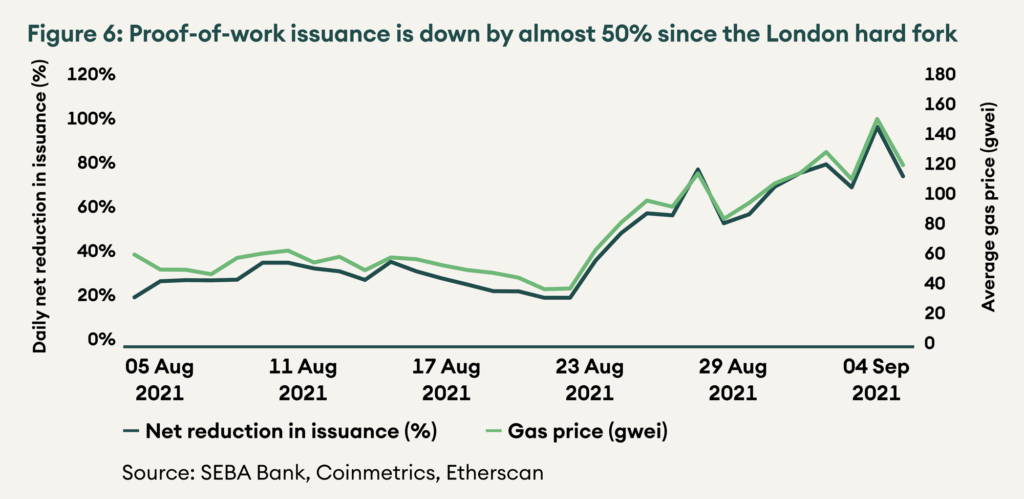
High gas prices also bring up an important problem that is plaguing the Ethereum ecosystem. The cost of a transaction on Ethereum have become prohibitive for small users. At a gas price of 100 gwei, the most basic transaction, an ETH transfer costs USD 8. More intensive transactions like executing a swap on an AMM like Uniswap can cost more than USD 100. The future of finance is excluding those that most need it. However, scaling solutions are on the horizon. Roll-ups and sidechains are already live on the mainnet, and innovation is happening fast. We will cover the topic of scaling in an upcoming “The Bridge”, our educational publication.
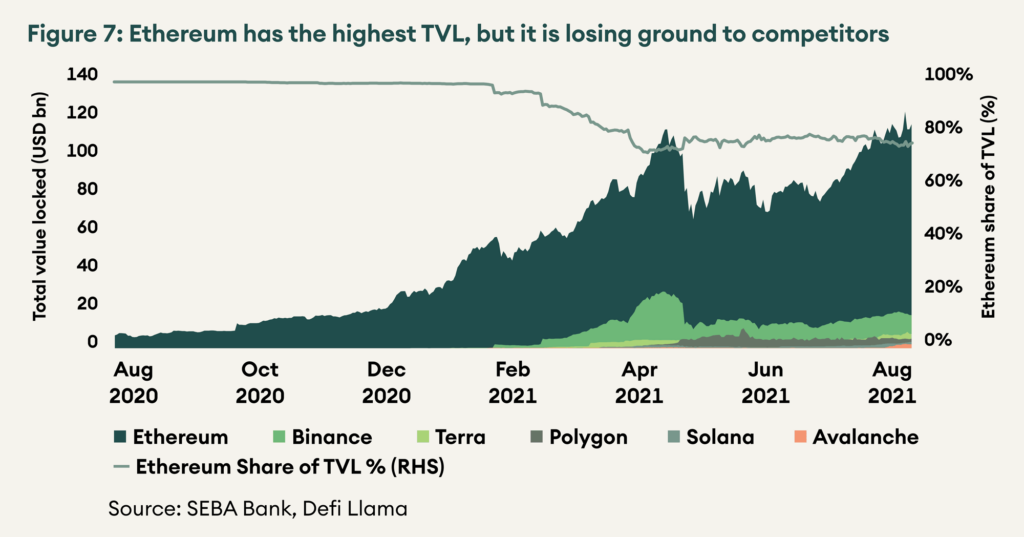
Gas prices being high, Ethereum has lost market share to competitor smart contract platforms. Luna, Solana and Avalanche have seen the total value locked on the platforms increase by 70%, 140% and 1028% in August. While there is a base effect, it is undeniable that Ethereum’s share of total value locked (TVL) across chains has fallen from 99% at the beginning of the year to 77% now.
Figure 7: Ethereum has the highest TVL, but it is losing ground to competitors
Platform chains
Cardano and Polkadot were the best performers for the month as both of them have exciting upgrades on the horizon. Smart contracts will be going live on Cardano on 12 September 2021. This will be a full launch of the smart contract capability of the network; however, some tooling to create applications will be rolling out in subsequent months. In the previous Digital Investor, we wrote that it would be crucial for the success of Cardano that basic applications like a decentralised exchange and a stable coin pass the testing phase. Because Cardano uses a UTXO-based accounting model, there may be difficulty in concurrent execution of swaps on-chain as previous transactions must be settled before new ones can be made. IOHK noted that while developers are more familiar with account-based models, solutions for the concurrency problem will be available by launch.
For Polkadot, we look to its canary network Kusama to see the progress. The second batch of Kusama Parachain auctions have begun, and the first auction is underway. Kilt Spiritnet, a blockchain identity protocol for issuing self-sovereign, anonymous and verifiable credentials, hit the maximum cap of 220,000 KSM in less than 24 hours, with 7,997 investors backing the project. With this, Kilt Spiritnet is set to secure the next slot on the Kusama network.
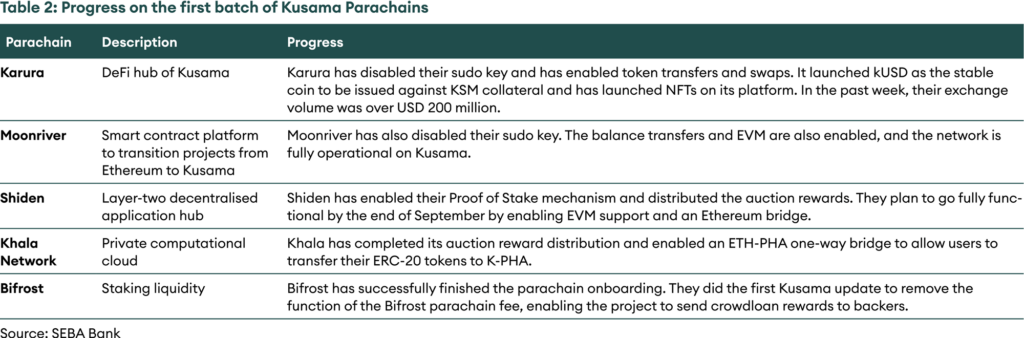
The first set of parachain auctions saw Karura, Moonriver, Shiden, Khala and Bifrost as the winners. Since the onboarding, each parachain has been working on a phased launch. The table below gives an update on the status of the first batch of parachains.
Table 2: Progress on the first batch of Kusama Parachains
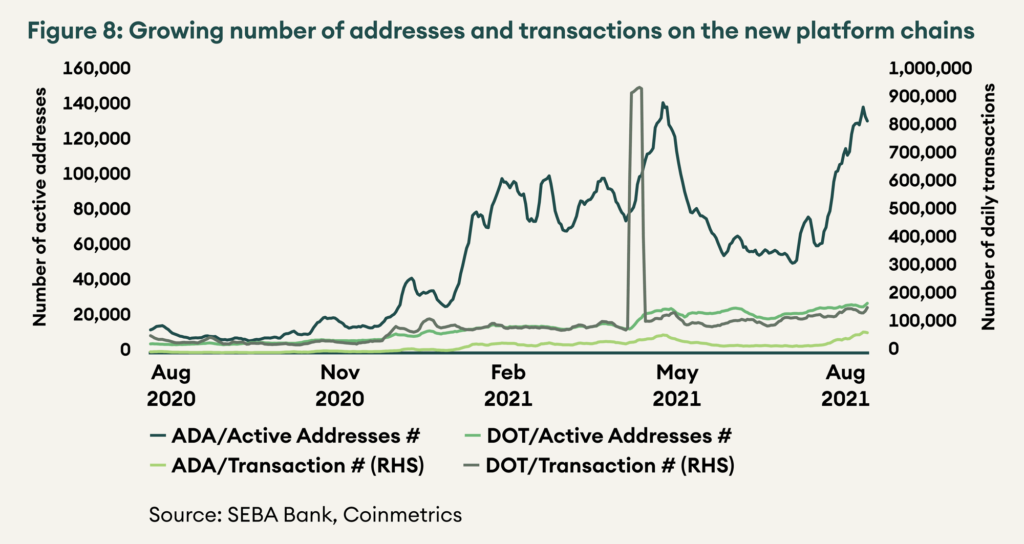
Until these upgrades go live, we can only compare the adoption and interest in the two chains by looking at the number of active addresses and daily transactions. Cardano saw an increase in active addresses and transactions by more than 70% in August, while those on Polkadot only grew by ~22%.
Figure 8: Growing number of addresses and transactions on the new platform chains
Decentralised Finance
Decentralised finance applications are the underperformers for the year. However, there is period bias here. In August 2020, decentralised finance platforms had a significant increase in prices, but that has now fallen out of the period under consideration. By adding a month to the period under consideration to 396 days instead of 365 days, YFI’s performance changes from 10% to 919%.
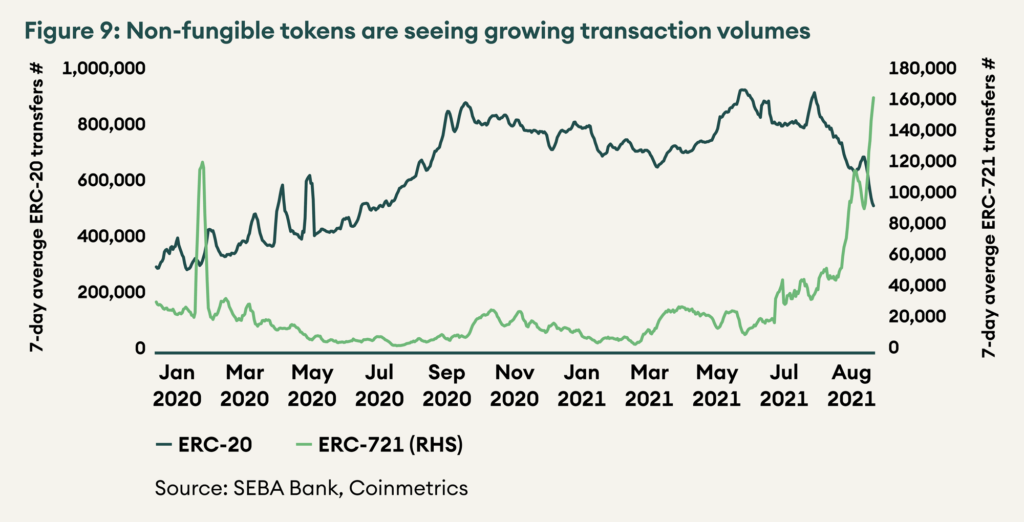
Their underperformance in the current month is explained by the popularity of non-fungible tokens or NFTs. This is evident from the pace of increase in the NFT token transfer (ERC-721) versus the fungible token transfer (ERC-20) that DeFi applications utilise. To read more about non-fungible tokens, please refer to our publication on it, “NFT: A New Fancy Technology”.
Figure 9: Non-fungible tokens are seeing growing transaction volumes
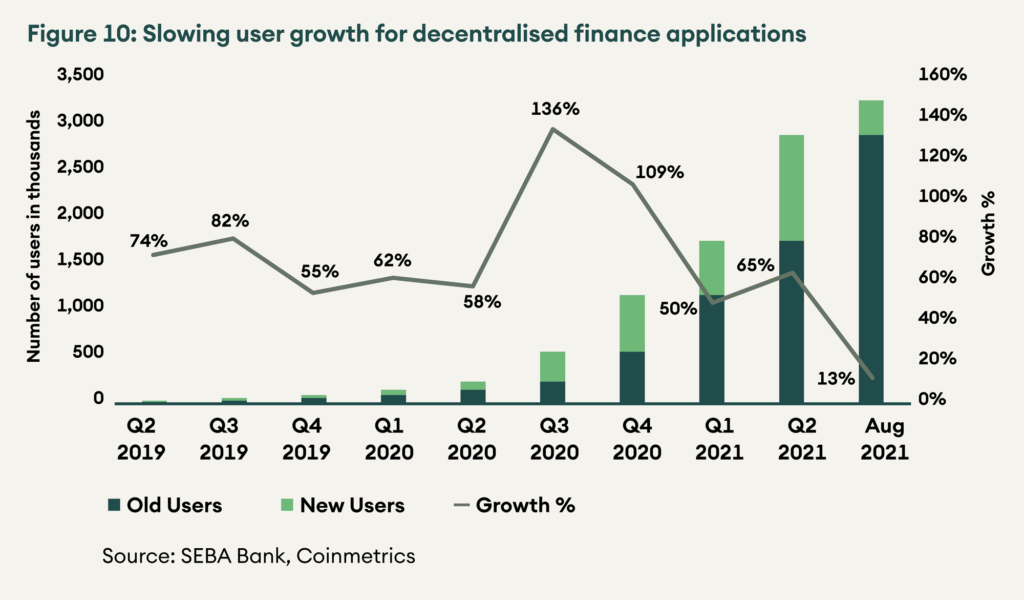
User growth on DeFi has suffered. While Q2 2021 saw more than 1.1 mn new users, in the two months of the current quarter, only 376,000 users have been added. Average quarterly growth in users has fallen from 65% in Q2 2021 to only 13% so far in Q3 2021. The slowing user growth is also a consequence of the high gas fees on Ethereum as retail users have moved to cheaper platforms.
Figure 10: Slowing user growth for decentralised finance applications
DeFi platforms are innovating to address the problem of slowing user growth. One solution is to onboard institutions to the platforms. Aave is building “Aave Arc” that will provide institutes permissioned access to the platform. Institutions will be able to participate in private pools where only those users who have passed a know-your-customer procedure may participate. Uniswap has been in talks with several institutions like Robinhood to provide crypto liquidity on their platforms. It is interesting to note that crypto assets now contribute 41% to the total revenue for Robinhood.
While NFTs currently have a more significant mind share, they are not a competitor or threat to DeFi. DeFi and NFTs can integrate in innovative ways; for example, an NFT may be used as collateral on a DeFi lending protocol. Uniswap v3’s liquidity tokens already use the NFT token standard.
There were unfavourable developments on the regulatory front. The US Senate passed the Infrastructure Bill was, and it will now go to Congress for approval before it becomes law. We will cover the implication of the US Infrastructure Bill in the upcoming Digital Regulator.
The Securities and Exchange Commission is also reportedly investigating Uniswap Labs, the team behind Uniswap protocol. The chair of the SEC, Gensler, also commented that DeFi applications look like the type of entities that the regulator oversees and may come under greater purview.
Conclusion
Bitcoin has recovered significantly from the fall, lifting hopes that the cycle top is not yet behind. We look at the past to decipher the future and see that the 2021 cycle rhymes with the 2013 cycle. If the similarities continue, we can look forward to another all-time high later this year. At the end of August, Bitcoin trades only 34% away from the all-time high before it goes into price discovery mode. A strong September will complete a recovery quarter and set the pace for new highs in Q4 2021. Platform chains are much closer to their all-time highs and have more substantial tailwinds as new developments are on the horizon. DeFi is the furthest away and will need to innovate to capture user attention again.
Table 3: Distance from all-time high for all assets under coverage